Y = a + b1*X1 + b2*X2 + ... +bp*Xp
Note that in this equation, the regression coefficients (or B coefficients) represent the independent contributions of each independent variable to the prediction of the dependent variable. However, their values may not be comparable between variables because they depend on the units of measurement or ranges of the respective variables. Some software products will produce both the raw regression coefficients (B coefficients) and the Beta coefficients (note that the Beta coefficients are comparable across variables).
See also, the Multiple Regression chapter.
Back Propagation (in Neural Networks). Back propagation is the best known training algorithm for neural networks and still one of the most useful. Devised independently by Rumelhart et. al. (1986), Werbos (1974), and Parker (1985), it is thoroughly described in most neural network textbooks (e.g., Patterson, 1996; Fausett, 1994; Haykin, 1994). It has lower memory requirements than most algorithms, and usually reaches an acceptable error level quite quickly, although it can then be very slow to converge properly on an error minimum. It can be used on most types of networks, although it is most appropriate for training multilayer perceptrons.
Back propagation includes:
Time-dependent learning rate
Time-dependent momentum rate
Random shuffling of order of presentation.
Additive noise during training
Independent testing on selection set
A variety of stopping conditions
RMS error plotting: graph
Selectable error function
The last five bulleted items are equally available in other iterative algorithms, including conjugate gradient descent, Quasi-Newton, Levenberg-Marquardt, quick propagation, Delta-bar-Delta, and Kohonen training (apart from noise in conjugate gradients, Kohonen and Levenberg-Marquardt, and selectable error function in Levenberg-Marquardt).
Technical Details. The on-line version of back propagation calculates the local gradient of each weight with respect to each case during training. Weights are updated once per training case.
The update formula is:
![]()
h - the learning rate
d - the local error gradient
a - the momentum coefficient
oi - the output of the i'th unit
Thresholds are treated as weights with oi = -1.
The local error gradient calculation depends on whether the unit into which the weights feed is in the output layer or the hidden layers.
Local gradients in output layers are the product of the derivatives of the network's error function and the units' activation functions.
Local gradients in hidden layers are the weighted sum of the unit's outgoing weights and the local gradients of the units to which these weights connect.
Bagging (Voting, Averaging). The concept of bagging (voting for classification, averaging for regression-type problems with continuous dependent variables of interest) applies to the area of predictive data mining, to combine the predicted classifications (prediction) from multiple models, or from the same type of model for different learning data. It is also used to address the inherent instability of results when applying complex models to relatively small data sets.Suppose your data mining task is to build a model for predictive classification, and the dataset from which to train the model (learning data set, which contains observed classifications) is relatively small. You could repeatedly sub-sample (with replacement) from the dataset, and apply, for example, a tree classifier (e.g., C&RT and CHAID) to the successive samples. In practice, very different trees will often be grown for the different samples, illustrating the instability of models often evident with small datasets. One method of deriving a single prediction (for new observations) is to use all trees found in the different samples, and to apply some simple voting: The final classification is the one most often predicted by the different trees. Note that some weighted combination of predictions (weighted vote, weighted average) is also possible, and commonly used. A sophisticated (machine learning) algorithm for generating weights for weighted prediction or voting is the Boosting procedure.
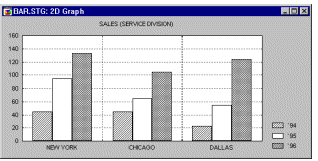
Bar/Column Plots, 2D. The Bar/Column Plot represents sequences of values as bars or columns (one case is represented by one bar/column). If more than one variable is selected, each plot can be represented in a separate graph or all of them can be combined in one display as multivariate clusters of bars/columns (one cluster per case, see example below).
Bar Dev Plot. The "bar deviation" plot is similar to the Bar X plot, in that individual data points are represented by vertical bars, however, the bars connect the data points to a user-selectable baseline. If the baseline value is different than the plot's Y-axis minimum, then individual bars will extend either up or down, depending on the direction of the "deviation" of individual data points from the baseline.
Bar Left Y Plot. In this plot, one horizontal bar is drawn for each data point (i.e., each pair of XY coordinates, see example below), connecting the data point and the left Y-axis. The vertical position of the bar is determined by the data point's Y value, and its length by the respective X value.
Bar Right Y Plot. In this plot, one horizontal bar is drawn for each data point (i.e., each pair of XY coordinates), connecting the data point and the right Y-axis. The vertical position of the bar is determined by the data point's Y value, and its length by the respective X value.
Bar Top Plot. (Also known as "hanging" column plots.) In this plot, one vertical bar is drawn for each data point (i.e., each pair of XY coordinates), connecting the data point and the upper X-axis. The horizontal position of the bar is determined by the data point's X value, and its length by the respective Y value.
Bar X Plot. In this plot, one vertical bar is drawn for each data point (i.e., each pair of XY coordinates), connecting the data point and the lower X-axis.

The horizontal position of the bar is determined by the data point's X value, and its height by the respective Y value.
Bartlett Window. In Time Series, the Bartlett window is a weighted moving average transformation used to smooth the periodogram values. In the Bartlett window (Bartlett, 1950) the weights are computed as:
wj = 1-(j/p) (for j = 0 to p)
w-j = wj (for j  0)
0)
where p = (m-1)/2
This weight function will assign the greatest weight to the observation being smoothed in the center of the window, and increasingly smaller weights to values that are further away from the center.
See also, Basic Notations and Principles.
Batch algorithms in STATISTICA Neural Networks. Algorithms which calculate the average gradient over an epoch, rather than adjusting on a case-by-case basis during training. Quick propagation, Delta-Bar-Delta, conjugate gradient descent and Levenberg-Marquardt are all batch algorithms.
Bayesian Networks. Networks based on Bayes' theorem, on the inference of probability distributions from data sets.
See also, probabilistic and generalized regression neural networks.
Bayesian Statistics (Analysis). Bayesian analysis is an approach to statistical analysis that is based on the Bayes's law, which states that the posterior probability of a parameter p is proportional to the prior probability of parameter p multiplied by the likelihood of p derived from the data collected. This increasingly popular methodology represents an alternative to the traditional (or frequentist probability) approach: whereas the latter attempts to establish confidence intervals around parameters, and/or falsify a-priori null-hypotheses, the Bayesian approach attempts to keep track of how a-priori expectations about some phenomenon of interest can be refined, and how observed data can be integrated with such a-priori beliefs, to arrive at updated posterior expectations about the phenomenon.
A good metaphor (and actual application) for the Bayesian approach is that of a physician who applies consecutive examinations to a patient so as to refine the certainty of a particular diagnosis: The results of each individual examination or test should be combined with the a-priori knowledge about the patient, and expectation that the respective diagnosis is correct. The goal is to arrive at a final diagnosis which the physician believes to be correct with a known degree of certainty.
Bernoulli Distribution. The Bernoulli distribution best describes all situations where a "trial" is made resulting in either "success" or "failure," such as when tossing a coin, or when modeling the success or failure of a surgical procedure. The Bernoulli distribution is defined as:
f(x) = px * (1-p)1-x
for x
where p is the probability that a particular event (e.g., success) will occur.
For a complete listing of all distribution functions, see Distributions and Their Functions.
Best Network Retention. A facility (implemented in STATISTICA Neural Networks) to automatically store the best neural network discovered during training, for later restoration at the end of a set of experiments.
See also the chapter on Neural Networks.
Best Subset Regression. A model-building technique which finds subsets of predictor variables that best predict responses on a dependent variable by linear (or nonlinear) regression.
For an overview of best subset regression see the General Regression Models chapter; for nonlinear stepwise and best subset regression, see the Generalized Linear Models chapter.
Beta Coefficients. The Beta coefficients are the regression coefficients you would have obtained had you first standardized all of your variables to a mean of 0 and a standard deviation of 1. Thus, the advantage of Beta coefficients (as compared to B coefficients which are not standardized) is that the magnitude of these Beta coefficients allow you to compare the relative contribution of each independent variable in the prediction of the dependent variable.
See also, the Multiple Regression chapter.
Beta Distribution. The beta distribution (the term first used by Gini, 1911) is defined as:
f(x) =  (
( +
+ )/(()()) * x-1 * (1-x)-1
0  x 1
x 1
> 0, > 0
where
(gamma) is the Gamma function
, are the shape parameters
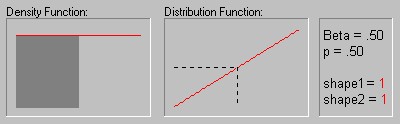
The animation above shows the beta distribution as the two shape parameters change.
Bimodal Distribution. A distribution that has two modes (thus two "peaks").

Bimodality of the distribution in a sample is often a strong indication that the distribution of the variable in population is not normal. Bimodality of the distribution may provide important information about the nature of the investigated variable (i.e., the measured quality). For example, if the variable represents a reported preference or attitude, then bimodality may indicate a polarization of opinions. Often however, the bimodality may indicate that the sample is not homogenous and the observations come in fact from two or more "overlapping" distributions. Sometimes, bimodality of the distribution may indicate problems with the measurement instrument (e.g, "gage calibration problems" in natural sciences, or "response biases" in social sciences).
See also unimodal distribution, multimodal distribution.
Binomial Distribution. The binomial distribution (the term first used by Yule, 1911) is defined as:
f(x) = [n!/(x!*(n-x)!)] * px * qn-x
for x = 0, 1, 2, ..., n
where
p is the probability of success at each trial
q is equal to 1-p
n is the number of independent trials
Bivariate Normal Distribution. Two variables follow the bivariate normal distribution if for each value of one variable, the corresponding values of another variable are normally distributed. The bivariate normal probability distribution function for a pair of continuous random variables (X and Y) is given by:
f(x,y) = {1/[2  12 * (1- 12 * (1- )1/2]} * exp )1/2]} * exp [-1/2(1-2)] * {[(x- [-1/2(1-2)] * {[(x- 1)/1]2 - 1)/1]2 - |
2[(x-1)/1] * [(y-2)/2] + [(y-2)/2]2} |
- < x < , - < y < , - < 1 < , - < 2 < , 1 > 0, 2 > 0, and -1 < < 1 < x < , - < y < , - < 1 < , - < 2 < , 1 > 0, 2 > 0, and -1 < < 1 |
where
1, 2 are the respective means of the random variables X and Y
1, 2 are the respective standard deviations of the random variables X and Y
is the correlation coefficient of X and Y
e is the
base of the natural logarithm, sometimes called Euler's e (2.71...)
is the constant Pi (3.14...)
See also, Normal Distribution, Elementary Concepts (Normal Distribution)
Blocking (in Experimental Design). In some experiments, observations are organized in natural "chunks" or blocks. You want to make sure that these blocks do not bias your estimates of main effects or interactions. For example, consider an experiment to improve the quality of special ceramics, produced in a kiln. The size of the kiln is limited so that you cannot produce all runs (observations) of your experiment at once. In that case you need to break up the experiment into blocks. However, you do not want to run positive factor settings (for all factors in your experiment) in one block, and all negative settings in the other. Otherwise, any incidental differences between blocks would systematically affect all estimates of the main effects and interactions of the factors of interest. Rather, you want to distribute the runs over the blocks so that any differences between blocks (i.e., the blocking factor) do not bias your results for the factor effects of interest. This is accomplished by treating the blocking factor as another factor in the design. Blocked designs often also have the advantage of being statistically more powerful, because they allow you to estimate and control the variability in the production process that is due to differences between blocks.For a detailed discussion of various blocked designs, and for examples of how to analyze such designs, see the Experimental Design and General Linear Models chapters.
Bonferroni Adjustment. When performing multiple statistical significance tests on the same data, the Bonferroni adjustment can be applied to make it more "difficult" for any one test to be statistically significant. For example, when reviewing multiple correlation coefficients form a correlation matrix, accepting and interpreting the correlations that are statistically significant at the conventional .05 level may be inappropriate, given that multiple tests are performed. Specifically, the alpha error probability of erroneously accepting the observed correlation coefficient as not-equal-to-zero when in fact (in the population) it is equal to zero may be much larger than .05 in this case.
The Bonferroni adjustment usually is accomplished by dividing the alpha level (usually set to .05, .01, etc.) by the number of tests being performing. For instance, suppose you performed multiple tests of individual correlations from the same correlation matrix. The Bonferroni adjusted level of significance for any one correlation would be:
.05 / 5 = .01
Any test that results in a p-value of less than .01 would be considered statistically significant; correlations with a probability value greater than .01 (including those with p-values between .01 and .05) would be considered non-significant.
Bonferroni test. This post hoc test can be used to determine the significant differences between group means in an analysis of variance setting. The Bonferroni test is very conservative when a large number of group means are being compared (for a detailed discussion of different post hoc tests, see Winer, Michels, & Brown (1991). For more details, see the General Linear Models chapter. See also, Post Hoc Comparisons. For a discussion of statistical significance, see Elementary Concepts.
Boosting. The concept of boosting applies to the area of predictive data mining, to generate multiple models or classifiers (for prediction or classification), and to derive weights to combine the predictions from those models into a single prediction or predicted classification (see also Bagging).
A simple algorithm for boosting works like this: Start by applying some method (e.g., a tree classifier such as C&RT or CHAID) to the learning data, where each observation is assigned an equal weight. Compute the predicted classifications, and apply weights to the observations in the learning sample that are inversely proportional to the accuracy of the classification. In other words, assign greater weight to those observations that were difficult to classify (where the misclassification rate was high), and lower weights to those that were easy to classify (where the misclassification rate was low). In the context of C&RT for example, different misclassification costs (for the different classes) can be applied, inversely proportional to the accuracy of prediction in each class. Then apply the classifier again to the weighted data (or with different misclassification costs), and continue with the next iteration (application of the analysis method for classification to the re-weighted data).
Boosting will generate a sequence of classifiers, where each consecutive classifier in the sequence is an "expert" in classifying observations that were not well classified by those preceding it. During deployment (for prediction or classification of new cases), the predictions from the different classifiers can then be combined (e.g., via voting, or some weighted voting procedure) to derive a single best prediction or classification.
Note that boosting can also be applied to learning methods that do not explicitly support weights or misclassification costs. In that case, random sub-sampling can be applied to the learning data in the successive steps of the iterative boosting procedure, where the probability for selection of an observation into the subsample is inversely proportional to the accuracy of the prediction for that observation in the previous iteration (in the sequence of iterations of the boosting procedure).
Boundary Case. A boundary case occurs when a parameter iterates to the "boundary" of the permissible "parameter space" (see Structural Equation Modeling). For example, a variance can only take on values from 0 to infinity. If, during iteration, the program attempts to move an estimate of a variance below zero, the program will constrain it to be on the boundary value of 0.For some problems (for example a Heywood Case in factor analysis), it may be possible to reduce the discrepancy function by estimating a variance to be a negative number. In that case, the program does "the best it can" within the permissible parameter space, but does not actually obtain the "global minimum" of the discrepancy function.
Box Plot/Medians (Block Stats Graphs). This type of Block Stats Graph will produce a box plot of medians (and min/max values and 25th and 75th percentiles) for the columns or rows of the block. Each box will represent data from one column or row.
Box Plot/Means (Block Stats Graphs). This type of Block Stats Graph will produce a box plot of means (and standard errors and standard deviations) for the columns or rows of the block. Each box will represent data from one column or row.
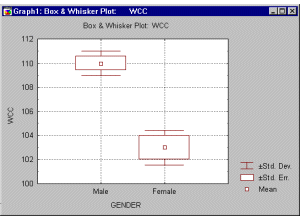
Box Plots, 2D. In Box Plots (this term was first used by Tukey, 1970), ranges or distribution characteristics of values of a selected variable (or variables) are plotted separately for groups of cases defined by values of a categorical (grouping) variable. The central tendency (e.g., median or mean), and range or variation statistics (e.g., quartiles, standard errors, or standard deviations) are computed for each group of cases and the selected values are presented in the selected box plot style. Outlier data points can also be plotted.
Box Plots, 2D - Box Whiskers. This type of box plot will place a box around the midpoint (i.e., mean or median) which represents a selected range (i.e., standard error, standard deviation, min-max, or constant) and whiskers outside of the box which also represent a selected range (see the example graph, below).
Box Plots, 2D - Boxes. This type of box plot will place a box around the midpoint (i.e., mean or median) which represents the selected range (i.e., standard error, standard deviation, min-max, or constant).
Box Plots, 2D - Whiskers. In this style of box plot, the range (i.e., standard error, standard deviation, min-max, or constant) is represented by "whiskers" (i.e., as a line with a serif on both ends, see graph below).
Box Plots, 3D. In Box Plots (this term was first used by Tukey, 1970), ranges or distribution characteristics of values of selected variables are plotted separately for groups of cases defined by values of a categorical (grouping) variable. The central tendency (e.g., median or mean), and range or variation statistics (e.g., quartiles, standard errors, or standard deviations) are computed for each group of cases and the selected values are presented in the selected box plot style. Outlier data points can also be plotted.
Box Plots 3D - Border-style Ranges. In this style of 3D Sequential Box Plot, the ranges of values of selected variables are plotted separately for groups of cases defined by values of a categorical (grouping) variable. The central tendency (e.g., median or mean), and range or variation statistics (e.g., quartiles, standard errors, or standard deviations) are computed for each variable and for each group of cases and the selected values are presented as points with "whiskers," and the ranges marked by the "whiskers" are connected with lines (i.e., range borders) separately for each variable.
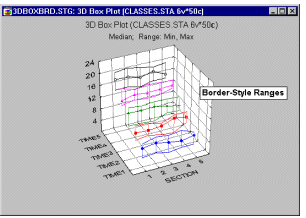
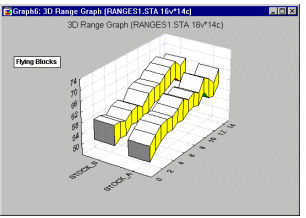
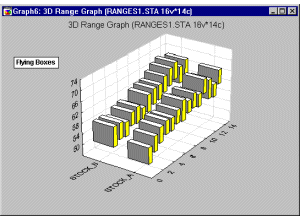
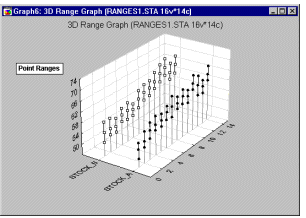
3D Range plots (see example graph below) differ from 3D Box plots in that for Range plots, the ranges are the values of the selected variables (e.g., one variable contains the minimum range values and another variable contains the maximum range values) while for Box plots, the ranges are calculated from variable values (e.g., standard deviations, standard errors, or min-max value).

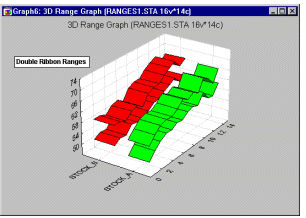
Box Plots 3D - Double Ribbon Ranges. In this style of 3D Sequential Box Plot, the ranges of values of selected variables are plotted separately for groups of cases defined by values of a categorical (grouping) variable. The range or variation statistics (e.g., quartiles, standard errors, or standard deviations) are computed for each variable and for each group of cases and the selected values are presented as double ribbons.

3D Range plots (see example graph below) differ from 3D Box plots in that for Range plots, the ranges are the values of the selected variables (e.g., one variable contains the minimum range values and another variable contains the maximum range values) while for Box plots the ranges are calculated from variable values (e.g., standard deviations, standard errors, or min-max value).
Box Plots 3D - Flying Blocks. In this style of 3D Sequential Box Plot, the ranges of values of selected variables are plotted separately for groups of cases defined by values of a categorical (grouping) variable. The central tendency (e.g., median or mean), and range or variation statistics (e.g., quartiles, standard errors, or standard deviations) are computed for each variable and for each group of cases and the selected values are presented as "flying" blocks.
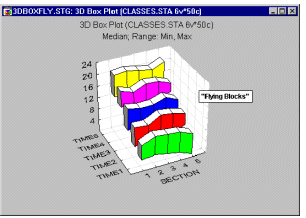
3D Range plots (see example graph below) differ from 3D Box plots in that for Range plots, the ranges are the values of the selected variables (e.g., one variable contains the minimum range values and another variable contains the maximum range values) while for Box plots the ranges are calculated from variable values (e.g., standard deviations, standard errors, or min-max value).
Box Plots 3D - Flying Boxes. In this style of 3D Sequential Box Plot, the ranges of values of selected variables are plotted separately for groups of cases defined by values of a categorical (grouping) variable. The central tendency (e.g., median or mean), and range or variation statistics (e.g., quartiles, standard errors, or standard deviations) are computed for each variable and for each group of cases and the selected values are presented "flying" boxes.
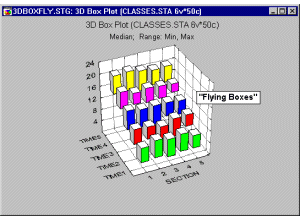
3D Range plots (see example graph below) differ from 3D Box plots in that for Range plots, the ranges are the values of the selected variables (e.g., one variable contains the minimum range values and another variable contains the maximum range values) while for Box plots the ranges are calculated from variable values (e.g., standard deviations, standard errors, or min-max value).
Box Plots 3D - Points. In this style of 3D Sequential Box Plot, the ranges of values of selected variables are plotted separately for groups of cases defined by values of a categorical (grouping) variable. The central tendency (e.g., median or mean), and range or variation statistics (e.g., quartiles, standard errors, or standard deviations) are computed for each variable and for each group of cases and the selected values are presented as point markers connected by a line.

3D Range plots (see example graph below) differ from 3D Box plots in that for Range plots, the ranges are the values of the selected variables (e.g., one variable contains the minimum range values and another variable contains the maximum range values) while for Box plots, the ranges are calculated from variable values (e.g., standard deviations, standard errors, or min-max value).
Box-Ljung Q Statistic. In Time Series analysis, you can shift a series by a given lag k. For that given lag, the Box-Ljung Q statistic is defined by:
Qk = n*(n+2)*Sum(ri2/(n-1))
for i = 1 to k
When the number of observations is large, then the Q statistic has a Chi- square distribution with k-p-q degrees of freedom, where p and q are the number of autoregressive and moving average parameters, respectively.
Breakdowns. Breakdowns are procedures which allow us to calculate descriptive statistics and correlations for dependent variables in each of a number of groups defined by one or more grouping (independent) variables. It is used as either a hypothesis testing or exploratory method.
For more information, see the Breakdowns section in the Basic Statistics chapter.
Brushing. Perhaps the most common and historically first widely used technique explicitly identified as graphical exploratory data analysis is brushing, an interactive method allowing one to select on-screen specific data points or subsets of data and identify their (e.g., common) characteristics, or to examine their effects on relations between relevant variables (e.g., in scatterplot matrices) or to identify (e.g., label) outliers. For more information on brushing, see Special Topics in Graphical Analytic Techniques: Brushing.
Burt Table. Multiple correspondence analysis expects as input (i.e., the program will compute prior to the analysis) a so-called Burt table. The Burt table is the result of the inner product of a design or indicator matrix. If you denote the data (design or indicator matrix) as matrix X, then matrix product X'X is a Burt table); shown below is an example of a Burt table that one might obtain in this manner.
| SURVIVAL | AGE | LOCATION | ||||||
|---|---|---|---|---|---|---|---|---|
| NO | YES | <50 | 50-69 | 69+ | TOKYO | BOSTON | GLAMORGN | |
| SURVIVAL:NO SURVIVAL:YES AGE:UNDER_50 AGE:A_50TO69 AGE:OVER_69 LOCATION:TOKYO LOCATION:BOSTON LOCATION:GLAMORGN |
210 0 68 93 49 60 82 68 |
0 554 212 258 84 230 171 153 |
68 212 280 0 0 151 58 71 |
93 258 0 351 0 120 122 109 |
49 84 0 0 133 19 73 41 |
60 230 151 120 19 290 0 0 |
82 171 58 122 73 0 253 0 |
68 153 71 109 41 0 0 221 |
Overall, the data matrix is symmetrical. In the case of 3 categorical variables (as shown above), the data matrix consists 3 x 3 = 9 partitions, created by each variable being tabulated against itself, and against the categories of all other variables. Note that the sum of the diagonal elements in each diagonal partition (i.e., where the respective variables are tabulated against themselves) is constant (equal to 764 in this case). The off-diagonal elements in each partition in this example are all 0. If the cases in the design or indicator matrix are assigned to categories via fuzzy coding, then the off- diagonal elements of the diagonal partitions are not necessarily equal to 0.
