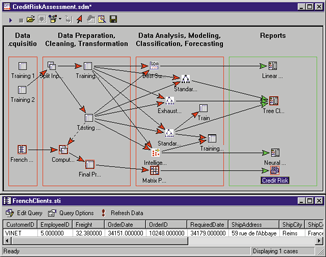
Data Mining
Data Mining as an analytic process designed to explore data (usually large amounts of - typically business or market related - data) in search for consistent patterns and/or systematic relationships between variables, and then to validate the findings by applying the detected patterns to new subsets of data. The ultimate goal of data mining is prediction - and predictive data mining is the most common type of data mining and one that has most direct business applications.
The process of data mining consists of three stages: (1) the initial exploration, (2) model building or pattern identification with validation/verification, and it is concluded with (3) deployment (i.e., the application of the model to new data in order to generate predictions).

Stage 1: Exploration. This stage usually starts with data preparation which may involve cleaning data, data transformations, selecting subsets of records and - in case of data sets with large numbers of variables ("fields") - performing some preliminary feature selection operations to bring the number of variables to a manageable range (depending on the statistical methods which are being considered). Then, depending on the nature of the analytic problem, this first stage of the process of data mining may involve anywhere between a simple choice of straightforward predictors for a regression model, to elaborate exploratory analyses using a wide variety of graphical and statistical methods (see Exploratory Data Analysis (EDA)) in order to identify the most relevant variables and determine the complexity and/or the general nature of models that can be taken into account in the next stage.
Stage 2: Model building and validation. This stage involves considering various models and choosing the best one based on their predictive performance (i.e., explaining the variability in question and producing stable results across samples). This may sound like a simple operation, but in fact, it sometimes involves a very elaborate process. There are a variety of techniques developed to achieve that goal - many of which are based on so-called "competitive evaluation of models," that is, applying different models to the same data set and then comparing their performance to choose the best. These techniques - which are often considered the core of predictive data mining - include: Bagging (Voting, Averaging), Boosting, Stacking (Stacked Generalizations), and Meta-Learning.
Stage 3: Deployment. That final stage involves using the model selected as best in the previous stage and applying it to new data in order to generate predictions or estimates of the expected outcome.
The concept of Data Mining is becoming increasingly popular as a business information management tool where it is expected to reveal knowledge structures that can guide decisions in conditions of limited certainty. Recently, there has been increased interest in developing new analytic techniques specifically designed to address the issues relevant to business Data Mining (e.g., Classification Trees), but Data Mining is still based on the conceptual principles of statistics including the traditional Exploratory Data Analysis (EDA) and modeling and it shares with them both some components of its general approaches and specific techniques.
However, an important general difference in the focus and purpose between Data Mining and the traditional Exploratory Data Analysis (EDA) is that Data Mining is more oriented towards applications than the basic nature of the underlying phenomena. In other words, Data Mining is relatively less concerned with identifying the specific relations between the involved variables. For example, uncovering the nature of the underlying functions or the specific types of interactive, multivariate dependencies between variables are not the main goal of Data Mining. Instead, the focus is on producing a solution that can generate useful predictions. Therefore, Data Mining accepts among others a "black box" approach to data exploration or knowledge discovery and uses not only the traditional Exploratory Data Analysis (EDA) techniques, but also such techniques as Neural Networks which can generate valid predictions but are not capable of identifying the specific nature of the interrelations between the variables on which the predictions are based.
Data Mining is often considered to be "a blend of statistics, AI [artificial intelligence], and data base research" (Pregibon, 1997, p. 8), which until very recently was not commonly recognized as a field of interest for statisticians, and was even considered by some "a dirty word in Statistics" (Pregibon, 1997, p. 8). Due to its applied importance, however, the field emerges as a rapidly growing and major area (also in statistics) where important theoretical advances are being made (see, for example, the recent annual International Conferences on Knowledge Discovery and Data Mining, co-hosted by the American Statistical Association).
For information on Data Mining techniques, please review the summary topics included below in this chapter of the Electronic Statistics Textbook. There are numerous books that review the theory and practice of data mining; the following books offer a representative sample of recent general books on data mining, representing a variety of approaches and perspectives:
Berry, M., J., A., & Linoff, G., S., (2000). Mastering data mining. New York: Wiley.
Edelstein, H., A. (1999). Introduction to data mining and knowledge discovery (3rd ed). Potomac, MD: Two Crows Corp.
Fayyad, U. M., Piatetsky-Shapiro, G., Smyth, P., & Uthurusamy, R. (1996). Advances in knowledge discovery & data mining. Cambridge, MA: MIT Press.
Han, J., Kamber, M. (2000). Data mining: Concepts and Techniques. New York: Morgan-Kaufman.
Hastie, T., Tibshirani, R., & Friedman, J. H. (2001). The elements of statistical learning : Data mining, inference, and prediction. New York: Springer.
Pregibon, D. (1997). Data Mining. Statistical Computing and Graphics, 7, 8.
Weiss, S. M., & Indurkhya, N. (1997). Predictive data mining: A practical guide. New York: Morgan-Kaufman.
Westphal, C., Blaxton, T. (1998). Data mining solutions. New York: Wiley.
Witten, I. H., & Frank, E. Data mining. New York: Morgan-Kaufmann.
Crucial Concepts in Data Mining
Stacked Generalization
See Stacking.
Feature Selection
Bagging (Voting, Averaging)
Boosting
A simple algorithm for boosting works like this: Start by applying some method (e.g., a tree classifier such as C&RT or CHAID) to the learning data, where each observation is assigned an equal weight. Compute the predicted classifications, and apply weights to the observations in the learning sample that are inversely proportional to the accuracy of the classification. In other words, assign greater weight to those observations that were difficult to classify (where the misclassification rate was high), and lower weights to those that were easy to classify (where the misclassification rate was low). In the context of C&RT for example, different misclassification costs (for the different classes) can be applied, inversely proportional to the accuracy of prediction in each class. Then apply the classifier again to the weighted data (or with different misclassification costs), and continue with the next iteration (application of the analysis method for classification to the re-weighted data).
Boosting will generate a sequence of classifiers, where each consecutive classifier in the sequence is an "expert" in classifying observations that were not well classified by those preceding it. During deployment (for prediction or classification of new cases), the predictions from the different classifiers can then be combined (e.g., via voting, or some weighted voting procedure) to derive a single best prediction or classification.
Note that boosting can also be applied to learning methods that do not explicitly support weights or misclassification costs. In that case, random sub-sampling can be applied to the learning data in the successive steps of the iterative boosting procedure, where the probability for selection of an observation into the subsample is inversely proportional to the accuracy of the prediction for that observation in the previous iteration (in the sequence of iterations of the boosting procedure).
Stacking (Stacked Generalization)
Suppose your data mining project includes tree classifiers, such as C&RT or CHAID, linear discriminant analysis (e.g., see GDA), and Neural Networks. Each computes predicted classifications for a crossvalidation sample, from which overall goodness-of-fit statistics (e.g., misclassification rates) can be computed. Experience has shown that combining the predictions from multiple methods often yields more accurate predictions than can be derived from any one method (e.g., see Witten and Frank, 2000). In stacking, the predictions from different classifiers are used as input into a meta-learner, which attempts to combine the predictions to create a final best predicted classification. So, for example, the predicted classifications from the tree classifiers, linear model, and the neural network classifier(s) can be used as input variables into a neural network meta-classifier, which will attempt to "learn" from the data how to combine the predictions from the different models to yield maximum classification accuracy.
Other methods for combining the prediction from multiple models or methods (e.g., from multiple datasets used for learning) are Boosting and Bagging (Voting).
Meta-Learning
Suppose your data mining project includes tree classifiers, such as C&RT and CHAID, linear discriminant analysis (e.g., see GDA), and Neural Networks. Each computes predicted classifications for a crossvalidation sample, from which overall goodness-of-fit statistics (e.g., misclassification rates) can be computed. Experience has shown that combining the predictions from multiple methods often yields more accurate predictions than can be derived from any one method (e.g., see Witten and Frank, 2000). The predictions from different classifiers can be used as input into a meta-learner, which will attempt to combine the predictions to create a final best predicted classification. So, for example, the predicted classifications from the tree classifiers, linear model, and the neural network classifier(s) can be used as input variables into a neural network meta-classifier, which will attempt to "learn" from the data how to combine the predictions from the different models to yield maximum classification accuracy.
One can apply meta-learners to the results from different meta-learners to create "meta-meta"-learners, and so on; however, in practice such exponential increase in the amount of data processing, in order to derive an accurate prediction, will yield less and less marginal utility.
Drill-Down Analysis
Deployment
Predictive Data Mining
Data Preparation (in Data Mining)
Data Reduction (for Data Mining)
See also predictive data mining, drill-down analysis.
Text Mining
Machine Learning
One of preliminary stages in the process of data mining applicable when the data set includes more variables than could be included (or would be efficient to include) in the actual model building phase (or even in initial exploratory operations).
The concept of bagging (voting for classification, averaging for regression-type problems with continuous dependent variables of interest) applies to the area of predictive data mining, to combine the predicted classifications (prediction) from multiple models, or from the same type of model for different learning data. It is also used to address the inherent instability of results when applying complex models to relatively small data sets. Suppose your data mining task is to build a model for predictive classification, and the dataset from which to train the model (learning data set, which contains observed classifications) is relatively small. You could repeatedly sub-sample (with replacement) from the dataset, and apply, for example, a tree classifier (e.g., C&RT and CHAID) to the successive samples. In practice, very different trees will often be grown for the different samples, illustrating the instability of models often evident with small datasets. One method of deriving a single prediction (for new observations) is to use all trees found in the different samples, and to apply some simple voting: The final classification is the one most often predicted by the different trees. Note that some weighted combination of predictions (weighted vote, weighted average) is also possible, and commonly used. A sophisticated (machine learning) algorithm for generating weights for weighted prediction or voting is the Boosting procedure.
The concept of boosting applies to the area of predictive data mining, to generate multiple models or classifiers (for prediction or classification), and to derive weights to combine the predictions from those models into a single prediction or predicted classification (see also Bagging).
The concept of stacking (short for Stacked Generalization) applies to the area of predictive data mining, to combine the predictions from multiple models. It is particularly useful when the types of models included in the project are very different.
The concept of meta-learning applies to the area of predictive data mining, to combine the predictions from multiple models. It is particularly useful when the types of models included in the project are very different. In this context, this procedure is also referred to as Stacking (Stacked Generalization).
The concept of drill-down analysis applies to the area of data mining, to denote the interactive exploration of data, in particular of large databases. The process of drill-down analyses begins by considering some simple break-downs of the data by a few variables of interest (e.g., Gender, geographic region, etc.). Various statistics, tables, histograms, and other graphical summaries can be computed for each group. Next one may want to "drill-down" to expose and further analyze the data "underneath" one of the categorizations, for example, one might want to further review the data for males from the mid-west. Again, various statistical and graphical summaries can be computed for those cases only, which might suggest further break-downs by other variables (e.g., income, age, etc.). At the lowest ("bottom") level are the raw data: For example, you may want to review the addresses of male customers from one region, for a certain income group, etc., and to offer to those customers some particular services of particular utility to that group.
The concept of deployment in predictive data mining refers to the application of a model for prediction or classification to new data. After a satisfactory model of set of models have been identified (trained) for a particular application, one usually wants to deploy those models so that predictions or predicted classifications can quickly be obtained for new data. For example, a credit card company may want to deploy a trained model or set of models (e.g., neural networks, meta-learner) to quickly identify transactions which have a high probability of being fraudulent.
The term Predictive Data Mining is usually applied to identify data mining projects with the goal to identify a statistical or neural network model or set of models that can be used to predict some response of interest. For example, a credit card company may want to engage in predictive data mining, to derive a (trained) model or set of models (e.g., neural networks, meta-learner) that can quickly identify transactions which have a high probability of being fraudulent. Other types of data mining projects may be more exploratory in nature (e.g., to identify cluster or segments of customers), in which case drill-down descriptive and exploratory methods would be applied. Data reduction is another possible objective for data mining (e.g., to aggregate or amalgamate the information in very large data sets into useful and manageable chunks).
Data preparation and cleaning is an often neglected but extremely important step in the data mining process. The old saying "garbage-in-garbage-out" is particularly applicable to the typical data mining projects where large data sets collected via some automatic methods (e.g., via the Web) serve as the input into the analyses. Often, the method by which the data where gathered was not tightly controlled, and so the data may contain out-of-range values (e.g., Income: -100), impossible data combinations (e.g., Gender: Male, Pregnant: Yes), and the like. Analyzing data that has not been carefully screened for such problems can produce highly misleading results, in particular in predictive data mining.
The term Data Reduction in the context of data mining is usually applied to projects where the goal is to aggregate or amalgamate the information contained in large datasets into manageable (smaller) information nuggets. Data reduction methods can include simple tabulation, aggregation (computing descriptive statistics) or more sophisticated techniques like **clustering, **principal components analysis, etc.
While Data Mining is typically concerned with the detection of patterns in numeric data, very often important (e.g., critical to business) information is stored in the form of text. Unlike numeric data, text is often amorphous, and difficult to deal with. Text mining generally consists of the analysis of (multiple) text documents by extracting key phrases, concepts, etc. and the preparation of the text processed in that manner for further analyses with numeric data mining techniques (e.g., to determine co-occurrences of concepts, key phrases, names, addresses, product names, etc.).
Machine learning, computational learning theory, and similar terms are often used in the context of Data Mining, to denote the application of generic model-fitting or classification algorithms for predictive data mining. Unlike traditional statistical data analysis, which is usually concerned with the estimation of population parameters by statistical inference, the emphasis in data mining (and machine learning) is usually on the accuracy of prediction (predicted classification), regardless of whether or not the "models" or techniques that are used to generate the prediction is interpretable or open to simple explanation. A good example of this type of technique often applied to predictive data mining are neural networks or meta-learning techniques such as boosting, etc. These methods usually involve the fitting of very complex "generic" models, that are not related to any reasoning or theoretical understanding of underlying causal processes; instead, these techniques can be shown to generate accurate predictions or classification in crossvalidation samples.
| To index |
Data Warehousing
StatSoft defines data warehousing as a process of organizing the storage of large, multivariate data sets in a way that facilitates the retrieval of information for analytic purposes.
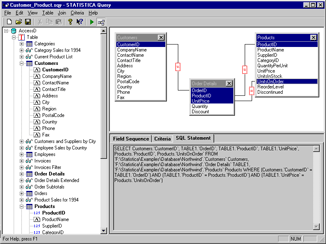
The most efficient data warehousing architecture will be capable of incorporating or at least referencing all data available in the relevant enterprise-wide information management systems, using designated technology suitable for corporate data base management (e.g., Oracle, Sybase, MS SQL Server. Also, a flexible, high-performance (see the IDP technology), open architecture approach to data warehousing - that flexibly integrates with the existing corporate systems and allows the users to organize and efficiently reference for analytic purposes enterprise repositories of data of practically any complexity - is offered in StatSoft enterprise systems such as SEDAS [STATISTICA Enterprise-wide Data Analysis System] and SEWSS [STATISTICA Enterprise-wide SPC System])], which can also work in conjunction with STATISTICA Data Miner and WebSTATISTICA Server Applications.
| To index |
On-Line Analytic Processing (OLAP)
The term On-Line Analytic Processing - OLAP (or Fast Analysis of Shared Multidimensional Information - FASMI) refers to technology that allows users of multidimensional databases to generate on-line descriptive or comparative summaries ("views") of data and other analytic queries. Note that despite its name, analyses referred to as OLAP do not need to be performed truly "on-line" (or in real-time); the term applies to analyses of multidimensional databases (that may, obviously, contain dynamically updated information) through efficient "multidimensional" queries that reference various types of data. OLAP facilities can be integrated into corporate (enterprise-wide) database systems and they allow analysts and managers to monitor the performance of the business (e.g., such as various aspects of the manufacturing process or numbers and types of completed transactions at different locations) or the market. The final result of OLAP techniques can be very simple (e.g., frequency tables, descriptive statistics, simple cross-tabulations) or more complex (e.g., they may involve seasonal adjustments, removal of outliers, and other forms of cleaning the data). Although Data Mining techniques can operate on any kind of unprocessed or even unstructured information, they can also be applied to the data views and summaries generated by OLAP to provide more in-depth and often more multidimensional knowledge. In this sense, Data Mining techniques could be considered to represent either a different analytic approach (serving different purposes than OLAP) or as an analytic extension of OLAP.
| To index |
Exploratory Data Analysis (EDA)
As opposed to traditional hypothesis testing designed to verify a priori hypotheses about relations between variables (e.g., "There is a positive correlation between the AGE of a person and his/her RISK TAKING disposition"), exploratory data analysis (EDA) is used to identify systematic relations between variables when there are no (or not complete) a priori expectations as to the nature of those relations. In a typical exploratory data analysis process, many variables are taken into account and compared, using a variety of techniques in the search for systematic patterns.
Computational exploratory data analysis methods include both simple basic statistics and more advanced, designated multivariate exploratory techniques designed to identify patterns in multivariate data sets.
Basic statistical exploratory methods. The basic statistical exploratory methods include such techniques as examining distributions of variables (e.g., to identify highly skewed or non-normal, such as bi-modal patterns), reviewing large correlation matrices for coefficients that meet certain thresholds (see example above), or examining multi-way frequency tables (e.g., "slice by slice" systematically reviewing combinations of levels of control variables).
![[Correlations Screenshot]](graphics/p204.gif)
Multivariate exploratory techniques. Multivariate exploratory techniques designed specifically to identify patterns in multivariate (or univariate, such as sequences of measurements) data sets include: Cluster Analysis, Factor Analysis, Discriminant Function Analysis, Multidimensional Scaling, Log-linear Analysis, Canonical Correlation, Stepwise Linear and Nonlinear (e.g., Logit) Regression, Correspondence Analysis, Time Series Analysis, and Classification Trees.
![[Cluster Analysis Screenshot]](graphics/p241.gif)
Neural Networks. Neural Networks are analytic techniques modeled after the (hypothesized) processes of learning in the cognitive system and the neurological functions of the brain and capable of predicting new observations (on specific variables) from other observations (on the same or other variables) after executing a process of so-called learning from existing data.
![[Neural Network Example]](graphics/snn_iris.gif)
For more information, see Neural Networks; see also STATISTICA Neural Networks.
Graphical (data visualization) EDA techniques
A large selection of powerful exploratory data analytic techniques is also offered by graphical data visualization methods that can identify relations, trends, and biases "hidden" in unstructured data sets.
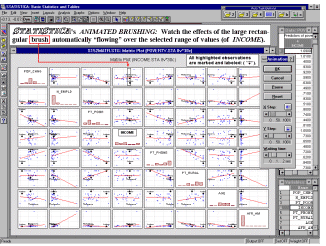 Brushing. Perhaps the most common and historically first widely used technique explicitly identified as graphical exploratory data analysis is brushing, an interactive method allowing one to select on-screen specific data points or subsets of data and identify their (e.g., common) characteristics, or to examine their effects on relations between relevant variables. Those relations between variables can be visualized by fitted functions (e.g., 2D lines or 3D surfaces) and their confidence intervals, thus, for example, one can examine changes in those functions by interactively (temporarily) removing or adding specific subsets of data. For example, one of many applications of the brushing technique is to
select (i.e., highlight) in a matrix scatterplot all data points that belong to a certain category (e.g., a "medium" income level, see the highlighted subset in the fourth component graph of the first row in the illustration left)
in order to examine how those specific observations contribute to relations between other variables in the same data set (e.g, the correlation between the "debt" and "assets" in the current example). If the brushing facility
supports features like "animated brushing" or "automatic function
re-fitting", one can define a dynamic brush that would move over the consecutive ranges of a criterion variable (e.g., "income" measured on a continuous scale or a discrete [3-level] scale as on the illustration above) and examine the dynamics of the contribution of the criterion variable to the relations between other relevant variables in the same data set.
![[2D Animated Brushing]](graphics/stdatmin2Dbrush_sm.gif) |
![[3D Animated Brushing]](graphics/stdatmin3Dbrush_sm.gif) |

shading, plotting confidence intervals and confidence areas (e.g., ellipses),
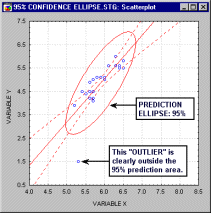
generating tessellations, spectral planes,
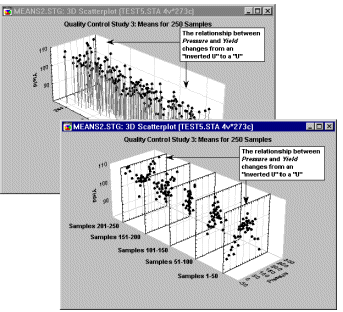
integrated layered compressions,
![[Layered Compression Screenshot]](graphics/p153.gif)
and projected contours, data image reduction techniques, interactive (and continuous) rotation
![[Data Rotation Animation]](graphics/an_rotate.gif)
with animated stratification (cross-sections) of 3D displays, and selective highlighting of specific series and blocks of data.
Verification of results of EDA
The exploration of data can only serve as the first stage of data analysis and its results can be treated as tentative at best as long as they are not confirmed, e.g., crossvalidated, using a different data set (or and independent subset). If the result of the exploratory stage suggests a particular model, then its validity can be verified by applying it to a new data set and testing its fit (e.g., testing its predictive validity). Case selection conditions can be used to quickly define subsets of data (e.g., for estimation and verification), and for testing the robustness of results.
| To index |
Neural Networks are analytic techniques modeled after the (hypothesized) processes of learning in the cognitive system and the neurological functions of the brain and capable of predicting new observations (on specific variables) from other observations (on the same or other variables) after executing a process of so-called learning from existing data. Neural Networks is one of the Data Mining techniques.
![[Neural Network]](graphics/neuralnw.gif)
The first step is to design a specific network architecture (that includes a specific number of "layers" each consisting of a certain number of "neurons"). The size and structure of the network needs to match the nature (e.g., the formal complexity) of the investigated phenomenon. Because the latter is obviously not known very well at this early stage, this task is not easy and often involves multiple "trials and errors." (Now, there is, however, neural network software that applies artificial intelligence techniques to aid in that tedious task and finds "the best" network architecture.)
The new network is then subjected to the process of "training." In that phase, neurons apply an iterative process to the number of inputs (variables) to adjust the weights of the network in order to optimally predict (in traditional terms one could say, find a "fit" to) the sample data on which the "training" is performed. After the phase of learning from an existing data set, the new network is ready and it can then be used to generate predictions.
![[STATISTICA Neural Networks Example]](graphics/snn_1.gif)
The resulting "network" developed in the process of "learning" represents a pattern detected in the data. Thus, in this approach, the "network" is the functional equivalent of a model of relations between variables in the traditional model building approach. However, unlike in the traditional models, in the "network," those relations cannot be articulated in the usual terms used in statistics or methodology to describe relations between variables (such as, for example, "A is positively correlated with B but only for observations where the value of C is low and D is high"). Some neural networks can produce highly accurate predictions; they represent, however, a typical a-theoretical (one can say, "a black box") research approach. That approach is concerned only with practical considerations, that is, with the predictive validity of the solution and its applied relevance and not with the nature of the underlying mechanism or its relevance for any "theory" of the underlying phenomena.
However, it should be mentioned that Neural Network techniques can also be used as a component of analyses designed to build explanatory models because Neural Networks can help explore data sets in search for relevant variables or groups of variables; the results of such explorations can then facilitate the process of model building. Moreover, now there is neural network software that uses sophisticated algorithms to search for the most relevant input variables, thus potentially contributing directly to the model building process.
One of the major advantages of neural networks is that, theoretically, they are capable of approximating any continuous function, and thus the researcher does not need to have any hypotheses about the underlying model, or even to some extent, which variables matter. An important disadvantage, however, is that the final solution depends on the initial conditions of the network, and, as stated before, it is virtually impossible to "interpret" the solution in traditional, analytic terms, such as those used to build theories that explain phenomena.
![[STATISTICA Neural Networks Example]](graphics/snn_2.gif)
Some authors stress the fact that neural networks use, or one should say, are expected to use, massively parallel computation models. For example Haykin (1994) defines neural network as:
"a massively parallel distributed processor that has a natural propensity for storing experiential knowledge and making it available for use. It resembles the brain in two respects: (1) Knowledge is acquired by the network through a learning process, and (2) Interneuron connection strengths known as synaptic weights are used to store the knowledge." (p. 2).
![[STATISTICA Neural Networks Example]](graphics/snn_3.gif)
However, as Ripley (1996) points out, the vast majority of contemporary neural network applications run on single-processor computers and he argues that a large speed-up can be achieved not only by developing software that will take advantage of multiprocessor hardware by also by designing better (more efficient) learning algorithms.
Neural networks is one of the methods used in Data Mining; see also Exploratory Data Analysis. For more information on neural networks, see Haykin (1994), Masters (1995), Ripley (1996), and Welstead (1994). For a discussion of neural networks as statistical tools, see Warner and Misra (1996). See also, STATISTICA Neural Networks.
| To index |
