A good theory is the end result of a winnowing process. We start with a comprehensive model that includes all conceivable, testable influences on the phenomena under investigation. Then we test the components of the initial comprehensive model, to identify the less comprehensive submodels that adequately account for the phenomena under investigation. Finally from these candidate submodels, we single out the simplest submodel, which by the principle of parsimony we take to be the "best" explananation for the phenomena under investigation.
We prefer simple models not just for philosophical but also for practical reasons. Simple models are easier to put to test again in replication and cross-validation studies. Simple models are less costly to put into practice in predicting and controlling the outcome in the future. The philosophical reasons for preferring simple models should not be downplayed, however. Simpler models are easier to understand and appreciate, and therefore have a "beauty" that their more complicated counterparts often lack.
The entire winnowing process described above is encapsulated in the model-building techniques of stepwise and best-subset regression. The use of these model-building techniques begins with the specification of the design for a comprehensive "whole model." Less comprehensive submodels are then tested to determine if they adequately account for the outcome under investigation. Finally, the simplest of the adequate is adopted as the "best."
| To index |
Unlike the multiple regression model, which is used to analyze designs with continuous predictor variables, the general linear model can be used to analyze any ANOVA design with categorical predictor variables, any ANCOVA design with both categorical and continuous predictor variables, as well as any regression design with continuous predictor variables. Effects for categorical predictor variables can be coded in the the design matrix X using either the overparameterized model or the sigma-restricted model.
Only the sigma-restricted parameterization can be used for model-building. True to its description as general, the general linear model can be used to analyze designs with effects for categorical predictor variables which are coded using either parameterization method. In many uses of the general linear model, it is arbitrary whether categorical predictors are coded using the sigma-restricted or the overparameterized coding. When one desires to build models, however, the use of the overparameterized model is unsatisfactory; lower-order effects for categorical predictor variables are redundant with higher-order containing interactions, and therefore cannot be fairly evaluated for inclusion in the model when higher-order containing interactions are already in the model.
This problem does not occur when categorical predictors are coded using the sigma-restricted parameterization, so only the sigma-restricted parameterization is necessary in general stepwise regression.
Designs which cannot be represented using the sigma-restricted parameterization. The sigma-restricted parameterization can be used to represent most, but not all types of designs. Specifically, the designs which cannot be represented using the sigma-restricted parameterization are designs with nested effects, such as nested ANOVA and separate slope, and random effects. Any other type of ANOVA, ANCOVA, or regression design can be represented using the sigma-restricted parameterization, and can therefore be analyzed with general stepwise regression.
Model building for designs with multiple dependent variables. Stepwise and best-subset model-building techniques are well-developed for regression designs with a single dependent variable (e.g., see Cooley and Lohnes, 1971; Darlington, 1990; Hocking Lindeman, Merenda, and Gold, 1980; Morrison, 1967; Neter, Wasserman, and Kutner, 1985; Pedhazur, 1973; Stevens, 1986; Younger, 1985). Using the sigma-restricted parameterization and general linear model methods, these model-building techniques can be readily applied to any ANOVA design with categorical predictor variables, any ANCOVA design with both categorical and continuous predictor variables, as well as any regression design with continuous predictor variables. Building models for designs with multiple dependent variables, however, involves considerations that are not typically addressed by the general linear model. Model-building techniques for designs with multiple dependent variables are available with Structural Equation Modeling.
| To index |
A wide variety of types of designs can be represented using the sigma-restricted coding of the design matrix X, and any such design can be analyzed using the general linear model. The following topics describe these different types of designs and how they differ. Some general ways in which designs might differ can be suggested, but keep in mind that any particular design can be a "hybrid" in the sense that it could have combinations of features of a number of different types of designs.
Concerning the nature or type of predictor variables, between designs which contain only categorical predictor variables can be called ANOVA (analysis of variance) designs, between designs which contain only continuous predictor variables can be called regression designs, and between designs which contain both categorical and continuous predictor variables can be called ANCOVA (analysis of covariance) designs.
Between designs may involve only a single predictor variable and therefore be described as simple (e.g., simple regression) or may employ numerous predictor variables (e.g., multiple regression).
Concerning the arrangement of predictor variables, some between designs employ only "main effect" or first-order terms for predictors, that is, the values for different predictor variables are independent and raised only to the first power. Other between designs may employ higher-order terms for predictors by raising the values for the original predictor variables to a power greater than 1 (e.g., in polynomial regression designs), or by forming products of different predictor variables (i.e., interaction terms). A common arrangement for ANOVA designs is the full-factorial design, in which every combination of levels for each of the categorical predictor variables is represented in the design. Designs with some but not all combinations of levels for each of the categorical predictor variables are aptly called fractional factorial designs.
These basic distinctions about the nature, number, and arrangement of predictor variables can be used in describing a variety of different types of between designs. Some of the more common between designs can now be described.
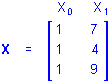
Simple Regression. Simple regression designs involve a single continuous predictor variable. If there were 3 cases with values on a predictor variable P of, say, 7, 4, and 9, and the design is for the first-order effect of P, the X matrix would be
and using P for X1 the regression equation would be
Y = b0 + b1P
If the simple regression design is for a higher-order effect of P, say the quadratic effect, the values in the X1 column of the design matrix would be raised to the 2nd power, that is, squared
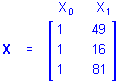
and using P2 for X1 the regression equation would be
Y = b0 + b1P2
In regression designs, values on the continuous predictor variables are raised to the desired power and used as the values for the X variables. No recoding is performed. It is therefore sufficient, in describing regression designs, to simply describe the regression equation without explicitly describing the design matrix X.
Multiple Regression. Multiple regression designs are to continuous predictor variables as main effect ANOVA designs are to categorical predictor variables, that is, multiple regression designs contain the separate simple regression designs for 2 or more continuous predictor variables. The regression equation for a multiple regression design for the first-order effects of 3 continuous predictor variables P, Q, and R would be
Y = b0 + b1P + b2Q + b3R
A discussion of mutiple regression methods is also provided in the Multiple Regression chapter.
Factorial Regression. Factorial regression designs are similar to factorial ANOVA designs, in which combinations of the levels of the factors are represented in the design. In factorial regression designs, however, there may be many more such possible combinations of distinct levels for the continuous predictor variables than there are cases in the data set. To simplify matters, full-factorial regression designs are defined as designs in which all possible products of the continuous predictor variables are represented in the design. For example, the full-factorial regression design for two continuous predictor variables P and Q would include the main effects (i.e., the first-order effects) of P and Q and their 2-way P by Q interaction effect, which is represented by the product of P and Q scores for each case. The regression equation would be
Y = b0 + b1P + b2Q + b3P*Q
Factorial regression designs can also be fractional, that is, higher-order effects can be omitted from the design. A fractional factorial design to degree 2 for 3 continuous predictor variables P, Q, and R would include the main effects and all 2-way interactions between the predictor variables
Y = b0 + b1P + b2Q + b3R + b4P*Q + b5P*R + b6Q*R
Polynomial Regression. Polynomial regression designs are designs which contain main effects and higher-order effects for the continuous predictor variables but do not include interaction effects between predictor variables. For example, the polynomial regression design to degree 2 for three continuous predictor variables P, Q, and R would include the main effects (i.e., the first-order effects) of P, Q, and R and their quadratic (i.e., second-order) effects, but not the 2-way interaction effects or the P by Q by R 3-way interaction effect.
Y = b0 + b1P + b2P2 + b3Q + b4Q2 + b5R + b6R2
Polynomial regression designs do not have to contain all effects up to the same degree for every predictor variable. For example, main, quadratic, and cubic effects could be included in the design for some predictor variables, and effects up the fourth degree could be included in the design for other predictor variables.
Response Surface Regression. Quadratic response surface regression designs are a hybrid type of design with characteristics of both polynomial regression designs and fractional factorial regression designs. Quadratic response surface regression designs contain all the same effects of polynomial regression designs to degree 2 and additionally the 2-way interaction effects of the predictor variables. The regression equation for a quadratic response surface regression design for 3 continuous predictor variables P, Q, and R would be
Y = b0 + b1P + b2P2 + b3Q + b4Q2 + b5R + b6R2 + b7P*Q + b8P*R + b9Q*R
These types of designs are commonly employed in applied research (e.g., in industrial experimation), and a detailed discussion of these types of designs is also presented in the Experimental Design chapter (see Central composite designs).
Mixture Surface Regression. Mixture surface regression designs are identical to factorial regression designs to degree 2 except for the omission of the intercept. Mixtures, as the name implies, add up to a constant value; the sum of the proportions of ingredients in different recipes for some material all must add up 100%. Thus, the proportion of one ingredient in a material is redundant with the remaining ingredients. Mixture surface regression designs deal with this redundancy by omitting the intercept from the design. The design matrix for a mixture surface regression design for 3 continuous predictor variables P, Q, and R would be
Y = b1P + b2P2 + b3Q + b4P*Q + b5P*R + b6Q*R
These types of designs are commonly employed in applied research (e.g., in industrial experimation), and a detailed discussion of these types of designs is also presented in the Experimental Design chapter (see Mixture designs and triangular surfaces).
One-Way ANOVA. A design with a single categorical predictor variable is called a one-way ANOVA design. For example, a study of 4 different fertilizers used on different individual plants could be analyzed via one-way ANOVA, with four levels for the factor Fertilizer.
Consider a single categorical predictor variable A with 1 case in each of its 3 categories. Using the sigma-restricted coding of A into 2 quantitative contrast variables, the matrix X defining the between design is
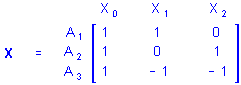
That is, cases in groups A1, A2, and A3 are all assigned values of 1 on X0 (the intercept), the case in group A1 is assigned a value of 1 on X1 and a value 0 on X2, the case in group A2 is assigned a value of 0 on X1 and a value 1 on X2, and the case in group A3 is assigned a value of -1 on X1 and a value -1 on X2. Of course, any additional cases in any of the 3 groups would be coded similarly. If there were 1 case in group A1, 2 cases in group A2, and 1 case in group A3, the X matrix would be
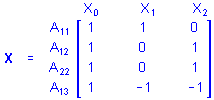
where the first subscript for A gives the replicate number for the cases in each group. For brevity, replicates usually are not shown when describing ANOVA design matrices.
Note that in one-way designs with an equal number of cases in each group, sigma-restricted coding yields X1 � Xk variables all of which have means of 0.
These simple examples show that the X matrix actually serves two purposes. It specifies (1) the coding for the levels of the original predictor variables on the X variables used in the analysis as well as (2) the nature, number, and arrangement of the X variables, that is, the between design.
Main Effect ANOVA. Main effect ANOVA designs contain separate one-way ANOVA designs for 2 or more categorical predictors. A good example of main effect ANOVA would be the typical analysis performed on screening designs as described in the context of the Experimental Design chapter.
Consider 2 categorical predictor variables A and B each with 2 categories. Using the sigma-restricted coding, the X matrix defining the between design is
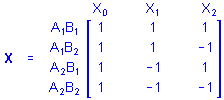
Note that if there are equal numbers of cases in each group, the sum of the cross-products of values for the X1 and X2 columns is 0, for example, with 1 case in each group (1*1)+(1*-1)+(-1*1)+(-1*-1)=0.
Factorial ANOVA. Factorial ANOVA designs contain X variables representing combinations of the levels of 2 or more categorical predictors (e.g., a study of boys and girls in four age groups, resulting in a 2 (Gender) x 4 (Age Group) design). In particular, full-factorial designs represent all possible combinations of the levels of the categorical predictors. A full-factorial design with 2 categorical predictor variables A and B each with 2 levels would be called a 2 x 2 full-factorial design. Using the sigma-restricted coding, the X matrix for this design would be
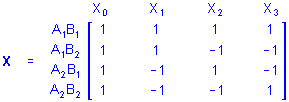
Several features of this X matrix deserve comment. Note that the X1 and X2 columns represent main effect contrasts for one variable, (i.e., A and B, respectively) collapsing across the levels of the other variable. The X3 column instead represents a contrast between different combinations of the levels of A and B. Note also that the values for X3 are products of the corresponding values for X1 and X2. Product variables such as X3 represent the multiplicative or interaction effects of their factors, so X3 would be said to represent the 2-way interaction of A and B. The relationship of such product variables to the dependent variables indicate the interactive influences of the factors on responses above and beyond their independent (i.e., main effect) influences on responses. Thus, factorial designs provide more information about the relationships between categorical predictor variables and responses on the dependent variables than is provided by corresponding one-way or main effect designs.
When many factors are being investigated, however, full-factorial designs sometimes require more data than reasonably can be collected to represent all possible combinations of levels of the factors, and high-order interactions between many factors can become difficult to interpret. With many factors, a useful alternative to the full-factorial design is the fractional factorial design. As an example, consider a 2 x 2 x 2 fractional factorial design to degree 2 with 3 categorical predictor variables each with 2 levels. The design would include the main effects for each variable, and all 2-way interactions between the three variables, but would not include the 3-way interactions between all three variables. These types of designs are discussed in detail in the 2**(k-p) Fractional Factorial Designs section of the Experimental Design chapter.
Analysis of Covariance. In general, between designs which contain both categorical and continuous predictor variables can be called ANCOVA designs. Traditionally, however, ANCOVA designs have referred more specifically to designs in which the first-order effects of one or more continuous predictor variables are taken into account when assessing the effects of one or more categorical predictor variables. A basic introduction to analysis of covariance can also be found in the Analysis of covariance (ANCOVA) topic of the ANOVA/MANOVA chapter.
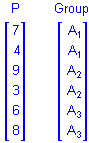
To illustrate, suppose a researcher wants to assess the influences of a categorical predictor variable A with 3 levels on some outcome, and that measurements on a continuous predictor variable P, known to covary with the outcome, are available. If the data for the analysis are
then the sigma-restricted X matrix for the design that includes the separate first-order effects of P and A would be
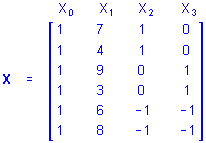
The b2 and b3 coefficients in the regression equation
Y = b0 + b1X1 + b2X2 + b3X3
represent the influences of group membership on the A categorical predictor variable, controlling for the influence of scores on the P continuous predictor variable. Similarly, the b1 coefficient represents the influence of scores on P controlling for the influences of group membership on A. This traditional ANCOVA analysis gives a more sensitive test of the influence of A to the extent that P reduces the prediction error, that is, the residuals for the outcome variable.
Homogeneity of Slopes. The appropriate design for modeling the influences of continuous and categorical predictor variables depends on whether the continuous and categorical predictors interact in influencing the outcome. The traditional analysis of covariance (ANCOVA) design for continuous and categorical predictor variables is appropriate when the continuous and categorical predictors do not interact in influencing responses on the outcome. The homogeneity of slopes designs can be used to test whether the continuous and categorical predictors interact in influencing responses. For the same example data used to illustrate the traditional ANCOVA design, the sigma-restricted X matrix for the homogeneity of slopes design would be
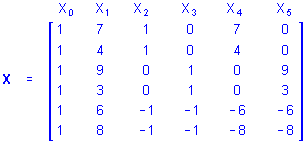
Using this design matrix X, if the b4 and b5 coefficients in the regression equation
Y = b0 + b1X1 + b2X2 + b3X3 + b4X4 + b5X5
are zero, the simpler traditional ANCOVA design should be used.
When there are multiple dependent variables in a design, the design is said to be multivariate. Multivariate measures of association are by nature more complex than their univariate counterparts (such as the correlation coefficient, for example). This is because multivariate measures of association must take into account not only the relationships of the predictor variables with responses on the dependent variables, but also the relationships among the multiple dependent variables. By doing so, however, these measures of association provide information about the strength of the relationships between predictor and dependent variables independent of the dependent variables interrelationships. A basic discussion of multivariate designs is also presented in the Multivariate Designs topic in the ANOVA/MANOVA chapter.
The most commonly used multivariate measures of association all can be expressed as functions of the eigenvalues of the product matrix
E-1H
where E is the error SSCP matrix (i.e., the matrix of sums of squares and cross-products for the dependent variables that are not accounted for by the predictors in the between design), and H is a hypothesis SSCP matrix (i.e., the matrix of sums of squares and cross-products for the dependent variables that are accounted for by all the predictors in the between design, or the sums of squares and cross-products for the dependent variables that are accounted for by a particular effect). If
li = the ordered eigenvalues of E-1H, if E-1 exists
then the 4 commonly used multivariate measures of association are
Wilks' lambda = P[1/(1+li)]
Pillai's trace = Sli/(1+li)
Hotelling-Lawley trace = Sli
Roy's largest root = l1
These 4 measures have different upper and lower bounds, with Wilks' lambda perhaps being the most easily interpretable of the four measures. Wilks' lambda can range from 0 to 1, with 1 indicating no relationship of predictors to responses and 0 indicating a perfect relationship of predictors to responses. 1 - Wilks' lambda can be interpreted as the multivariate counterpart of a univariate R-squared, that is, it indicates the proportion of generalized variance in the dependent variables that is accounted for by the predictors.
The 4 measures of association are also used to construct multivariate tests of significance. These multivariate tests are covered in detail in a number of sources (e.g., Finn, 1974; Tatsuoka, 1971).
| To index |
The following sections discuss details for building and testing hypotheses about the "whole model", for example, how sums of squares are partitioned and how the overall fit for the whole model is tested.
A fundamental principle of least squares methods is that variation on a dependent variable can be partitioned, or divided into parts, according to the sources of the variation. Suppose that a dependent variable is regressed on one or more predictor variables, and that for covenience the dependent variable is scaled so that its mean is 0. Then a basic least squares identity is that the total sum of squared values on the dependent variable equals the sum of squared predicted values plus the sum of squared residual values. Stated more generally,
S(y - y-bar)2 = S(y-hat - y-bar)2 + S(y - y-hat)2
where the term on the left is the total sum of squared deviations of the observed values on the dependent variable from the dependent variable mean, and the respective terms on the right are (1) the sum of squared deviations of the predicted values for the dependent variable from the dependent variable mean and (2) the sum of the squared deviations of the observed values on the dependent variable from the predicted values, that is, the sum of the squared residuals. Stated yet another way,
Total SS = Model SS + Error SS
Note that the Total SS is always the same for any particular data set, but that the Model SS and the Error SS depend on the regression equation. Assuming again that the dependent variable is scaled so that its mean is 0, the Model SS and the Error SS can be computed using
Model SS = b'X'Y
Error SS = Y'Y - b'X'Y
Given the Model SS and the Error SS, one can perform a test that all the regression coefficients for the X variables (b1 through bk, excluding the b0 coefficient for the intercept) are zero. This test is equivalent to a comparison of the fit of the regression surface defined by the predicted values (computed from the whole model regression equation) to the fit of the regression surface defined solely by the dependent variable mean (computed from the reduced regression equation containing only the intercept). Assuming that X'X is full-rank, the whole model hypothesis mean square
MSH = (Model SS)/k
where k is the number of columns of X (excluding the intercept column), is an estimate of the variance of the predicted values. The error mean square
s2 = MSE = (Error SS)/(n-k-1)
where n is the number of observations, is an unbiased estimate of the residual or error variance. The test statistic is
F = MSH/MSE
where F has (k, n - k - 1) degrees of freedom.
If X'X is not full rank, r + 1 is substituted for k, where r is the rank or the number of non-redundant columns of X'X.
If the whole model test is not significant the analysis is complete; the whole model is concluded to fit the data no better than the reduced model using the dependent variable mean alone. It is futile to seek a submodel which adequately fits the data when the whole model is inadequate.
Note that in the case of non-intercept models, some multiple regression programs will only compute the full model test based on the proportion of variance around 0 (zero) accounted for by the predictors; for more information (see Kvålseth, 1985; Okunade, Chang, and Evans, 1993). Other programs will actually compute both values (i.e., based on the residual variance around 0, and around the respective dependent variable means.
For designs such as one-way ANOVA or simple regression designs, the whole model test by itself may be sufficient for testing general hypotheses about whether or not the single predictor variable is related to the outcome. In complex designs, however, finding a statistically significant test of whole model fit is often just the first step in the analysis; one then seeks to identify simpler submodels that fit the data equally well (see the section on Basic ideas: The need for simple models). It is to this task, the search for submodels that fit the data well, that stepwise and best-subset regression are devoted.
| To index |
Stepwise model-building techniques for regression designs with a single dependent variable are described in numerous sources (e.g., see Darlington, 1990; Hocking, 1966, Lindeman, Merenda, and Gold, 1980; Morrison, 1967; Neter, Wasserman, and Kutner, 1985; Pedhazur, 1973; Stevens, 1986; Younger, 1985). The basic procedures involve (1) identifying an initial model, (2) iteratively "stepping," that is, repeatedly altering the model at the previous step by adding or removing a predictor variable in accordance with the "stepping criteria," and (3) terminating the search when stepping is no longer possible given the stepping criteria, or when a specified maximum number of steps has been reached. The following topics provide details on the use of stepwise model-building procedures.
The Initial Model in Stepwise Regression. The initial model is designated the model at Step 0. The initial model always includes the regression intercept (unless the No intercept option has been specified.). For the backward stepwise and backward removal methods, the initial model also includes all effects specified to be included in the design for the analysis. The initial model for these methods is therefore the whole model.
For the forward stepwise and forward entry methods, the initial model always includes the regression intercept (unless the No intercept option has been specified.). The initial model may also include 1 or more effects specified to be forced into the model. If j is the number of effects specified to be forced into the model, the first j effects specified to be included in the design are entered into the model at Step 0 . Any such effects are not eligible to be removed from the model during subsequent Steps.
Effects may also be specified to be forced into the model when the backward stepwise and backward removal methods are used. As in the forward stepwise and forward entry methods, any such effects are not eligible to be removed from the model during subsequent Steps.
The Forward Entry Method. The forward entry method is a simple model-building procedure. At each Step after Step 0, the entry statistic is computed for each effect eligible for entry in the model. If no effect has a value on the entry statistic which exceeds the specified critical value for model entry, then stepping is terminated, otherwise the effect with the largest value on the entry statistic is entered into the model. Stepping is also terminated if the maximum number of steps is reached.
The Backward Removal Method. The backward removal method is also a simple model-building procedure. At each Step after Step 0, the removal statistic is computed for each effect eligible to be removed from the model. If no effect has a value on the removal statistic which is less than the critical value for removal from the model, then stepping is terminated, otherwise the effect with the smallest value on the removal statistic is removed from the model. Stepping is also terminated if the maximum number of steps is reached.
The Forward Stepwise Method. The forward stepwise method employs a combination of the procedures used in the forward entry and backward removal methods. At Step 1 the procedures for forward entry are performed. At any subsequent step where 2 or more effects have been selected for entry into the model, forward entry is performed if possible, and backward removal is performed if possible, until neither procedure can be performed and stepping is terminated. Stepping is also terminated if the maximum number of steps is reached.
The Backward Stepwise Method. The backward stepwise method employs a combination of the procedures used in the forward entry and backward removal methods. At Step 1 the procedures for backward removal are performed. At any subsequent step where 2 or more effects have been selected for entry into the model, forward entry is performed if possible, and backward removal is performed if possible, until neither procedure can be performed and stepping is terminated. Stepping is also terminated if the maximum number of steps is reached.
Entry and Removal Criteria. Either critical F values or critical p values can be specified to be used to control entry and removal of effects from the model. If p values are specified, the actual values used to control entry and removal of effects from the model are 1 minus the specified p values. The critical value for model entry must exceed the critical value for removal from the model. A maximum number of Steps can also be specified. If not previously terminated, stepping stops when the specified maximum number of Steps is reached.
| To index |
All-possible-subset regression can be used as an alternative to or in conjunction with stepwise methods for finding the "best" possible submodel.
Neter, Wasserman, and Kutner (1985) discuss the use of all-possible-subset regression in conjunction with stepwise regression "A limitation of the stepwise regression search approach is that it presumes there is a single "best" subset of X variables and seeks to identify it. As noted earlier, there is often no unique "best" subset. Hence, some statisticians suggest that all possible regression models with a similar number of X variables as in the stepwise regression solution be fitted subsequently to study whether some other subsets of X variables might be better." (p. 435). This reasoning suggests that after finding a stepwise solution, the "best" of all the possible subsets of the same number of effects should be examined to determine if the stepwise solution is among the "best." If not, the stepwise solution is suspect.
All-possible-subset regression can also be used as an alternative to stepwise regression. Using this approach, one first decides on the range of subset sizes that could be considered to be useful. For example, one might expect that inclusion of at least 3 effects in the model is necessary to adequately account for responses, and also might expect there is no advantage to considering models with more than 6 effects. Only the "best" of all possible subsets of 3, 4, 5, and 6 effects are then considered.
Note that several different criteria can be used for ordering subsets in terms of "goodness." The most often used criteria are the subset multiple R-square, adjusted R-square, and Mallow's Cp statistics. When all-possible-subset regression is used in conjunction with stepwise methods, the subset multiple R-square statistic allows direct comparisons of the "best" subsets identified using each approach.
The number of possible submodels increases very rapidly as the number of effects in the whole model increases, and as subset size approaches half of the number of effects in the whole model. The amount of computation required to perform all-possible-subset regression increases as the number of possible submodels increases, and holding all else constant, also increases very rapidly as the number of levels for effects involving categorical predictors increases, thus resulting in more columns in the design matrix X. For example, all possible subsets of up to a dozen or so effects could certainly theoretically be computed for a design that includes two dozen or so effects all of which have many levels, but the computation would be very time consuming (e.g., there are about 2.7 million different ways to select 12 predictors from 24 predictors, i.e., 2.7 million models to evaluate just for subset size 12). Simpler is generally better when using all-possible-subset regression.
| To index |
