Step-by-step instructions for the computation and interpretation of capability indices are also provided in the Fundamental Statistical Process Control Reference Manual published by the ASQC (American Society for Quality Control) and AIAG (Automotive Industry Action Group, 1991; referenced as ASQC/AIAG, 1991). Repeatability and reproducibility (R & R) methods are discussed in Grant and Leavenworth (1980), Pyzdek (1989) and Montgomery (1991); a more detailed discussion of the subject (of variance estimation) is also provided in Duncan (1974).
Step-by-step instructions on how to conduct and analyze R & R experiments are presented in the Measurement Systems Analysis Reference Manual published by ASQC/AIAG (1990). In the following topics, we will briefly introduce the purpose and logic of each of these procedures. For more information on analyzing designs with random effects and for estimating components of variance, see the Variance Components chapter.
General Purpose
A common question that quality control engineers face is to determine how many items from a batch (e.g., shipment from a supplier) to inspect in order to ensure that the items (products) in that batch are of acceptable quality. For example, suppose we have a supplier of piston rings for small automotive engines that our company produces, and our goal is to establish a sampling procedure (of piston rings from the delivered batches) that ensures a specified quality. In principle, this problem is similar to that of on-line quality control discussed in Quality Control. In fact, you may want to read that section at this point to familiarize yourself with the issues involved in industrial statistical quality control.
Acceptance sampling. The procedures described here are useful whenever we need to decide whether or not a batch or lot of items complies with specifications, without having to inspect 100% of the items in the batch. Because of the nature of the problem -- whether or not to accept a batch -- these methods are also sometimes discussed under the heading of acceptance sampling.
Advantages over 100% inspection. An obvious advantage of acceptance sampling over 100% inspection of the batch or lot is that reviewing only a sample requires less time, effort, and money. In some cases, inspection of an item is destructive (e.g., stress testing of steel), and testing 100% would destroy the entire batch. Finally, from a managerial standpoint, rejecting an entire batch or shipment (based on acceptance sampling) from a supplier, rather than just a certain percent of defective items (based on 100% inspection) often provides a stronger incentive to the supplier to adhere to quality standards.
Computational Approach
In principle, the computational approach to the question of how large a sample to take is straightforward. Elementary Concepts discusses the concept of the sampling distribution. Briefly, if we were to take repeated samples of a particular size from a population of, for example, piston rings and compute their average diameters, then the distribution of those averages (means) would approach the normal distribution with a particular mean and standard deviation (or standard error; in sampling distributions the term standard error is preferred, in order to distinguish the variability of the means from the variability of the items in the population). Fortunately, we do not need to take repeated samples from the population in order to estimate the location (mean) and variability (standard error) of the sampling distribution. If we have a good idea (estimate) of what the variability (standard deviation or sigma) is in the population, then we can infer the sampling distribution of the mean. In principle, this information is sufficient to estimate the sample size that is needed in order to detect a certain change in quality (from target specifications). Without going into the details about the computational procedures involved, let us next review the particular information that the engineer must supply in order to estimate required sample sizes.
Means for H0 and H1
To formalize the inspection process of, for example, a shipment of piston rings, we can formulate two alternative hypotheses: First, we may hypothesize that the average piston ring diameters comply with specifications. This hypothesis is called the null hypothesis (H0). The second and alternative hypothesis (H1) is that the diameters of the piston rings delivered to us deviate from specifications by more than a certain amount. Note that we may specify these types of hypotheses not just for measurable variables such as diameters of piston rings, but also for attributes. For example, we may hypothesize (H1) that the number of defective parts in the batch exceeds a certain percentage. Intuitively, it should be clear that the larger the difference between H0 and H1, the smaller the sample necessary to detect this difference (see Elementary Concepts).
Alpha and Beta Error Probabilities
To return to the piston rings example, there are two types of mistakes that we can make when inspecting a batch of piston rings that has just arrived at our plant. First, we may erroneously reject H0, that is, reject the batch because we erroneously conclude that the piston ring diameters deviate from target specifications. The probability of committing this mistake is usually called the alpha error probability. The second mistake that we can make is to erroneously not reject H0 (accept the shipment of piston rings), when, in fact, the mean piston ring diameter deviates from the target specification by a certain amount. The probability of committing this mistake is usually called the beta error probability. Intuitively, the more certain we want to be, that is, the lower we set the alpha and beta error probabilities, the larger the sample will have to be; in fact, in order to be 100% certain, we would have to measure every single piston ring delivered to our company.
Fixed Sampling Plans
To construct a simple sampling plan, we would first decide on a sample size, based on the means under H0/H1 and the particular alpha and beta error probabilities. Then, we would take a single sample of this fixed size and, based on the mean in this sample, decide whether to accept or reject the batch. This procedure is referred to as a fixed sampling plan.
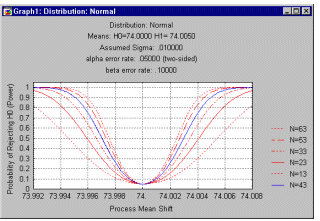
Operating characteristic (OC) curve. The power of the fixed sampling plan can be summarized via the operating characteristic curve. In that plot, the probability of rejecting H0 (and accepting H1) is plotted on the Y axis, as a function of an actual shift from the target (nominal) specification to the respective values shown on the X axis of the plot (see example below). This probability is, of course, one minus the beta error probability of erroneously rejecting H1 and accepting H0; this value is referred to as the power of the fixed sampling plan to detect deviations. Also indicated in this plot are the power functions for smaller sample sizes.
Sequential Sampling Plans
As an alternative to the fixed sampling plan, we could randomly choose individual piston rings and record their deviations from specification. As we continue to measure each piston ring, we could keep a running total of the sum of deviations from specification. Intuitively, if H1 is true, that is, if the average piston ring diameter in the batch is not on target, then we would expect to observe a slowly increasing or decreasing cumulative sum of deviations, depending on whether the average diameter in the batch is larger or smaller than the specification, respectively. It turns out that this kind of sequential sampling of individual items from the batch is a more sensitive procedure than taking a fixed sample. In practice, we continue sampling until we either accept or reject the batch.
Using a sequential sampling plan. Typically, we would produce a graph in which the cumulative deviations from specification (plotted on the Y-axis) are shown for successively sampled items (e.g., piston rings, plotted on the X-axis). Then two sets of lines are drawn in this graph to denote the "corridor" along which we will continue to draw samples, that is, as long as the cumulative sum of deviations from specifications stays within this corridor, we continue sampling.
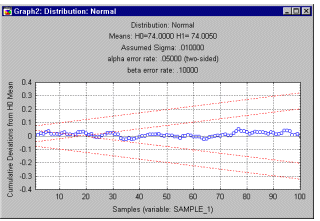
If the cumulative sum of deviations steps outside the corridor we stop sampling. If the cumulative sum moves above the upper line or below the lowest line, we reject the batch. If the cumulative sum steps out of the corridor to the inside, that is, if it moves closer to the center line, we accept the batch (since this indicates zero deviation from specification). Note that the inside area starts only at a certain sample number; this indicates the minimum number of samples necessary to accept the batch (with the current error probability).
Summary
To summarize, the idea of (acceptance) sampling is to use statistical "inference" to accept or reject an entire batch of items, based on the inspection of only relatively few items from that batch. The advantage of applying statistical reasoning to this decision is that we can be explicit about the probabilities of making a wrong decision.
Whenever possible, sequential sampling plans are preferable to fixed sampling plans because they are more powerful. In most cases, relative to the fixed sampling plan, using sequential plans requires fewer items to be inspected in order to arrive at a decision with the same degree of certainty.
| To index |
Introductory Overview
See also, Non-Normal Distributions.
Quality Control describes numerous methods for monitoring the quality of a production process. However, once a process is under control the question arises, "to what extent does the long-term performance of the process comply with engineering requirements or managerial goals?" For example, to return to our piston ring example, how many of the piston rings that we are using fall within the design specification limits? In more general terms, the question is, "how capable is our process (or supplier) in terms of producing items within the specification limits?" Most of the procedures and indices described here were only recently introduced to the US by Ford Motor Company (Kane, 1986). They allow us to summarize the process capability in terms of meaningful percentages and indices.
In this topic, the computation and interpretation of process capability indices will first be discussed for the normal distribution case. If the distribution of the quality characteristic of interest does not follow the normal distribution, modified capability indices can be computed based on the percentiles of a fitted non-normal distribution.
Order of business. Note that it makes little sense to examine the process capability if the process is not in control. If the means of successively taken samples fluctuate widely, or are clearly off the target specification, then those quality problems should be addressed first. Therefore, the first step towards a high-quality process is to bring the process under control, using the charting techniques available in Quality Control.
Computational Approach
Once a process is in control, we can ask the question concerning the process capability. Again, the approach to answering this question is based on "statistical" reasoning, and is actually quite similar to that presented earlier in the context of sampling plans. To return to the piston ring example, given a sample of a particular size, we can estimate the standard deviation of the process, that is, the resultant ring diameters. We can then draw a histogram of the distribution of the piston ring diameters. As we discussed earlier, if the distribution of the diameters is normal, then we can make inferences concerning the proportion of piston rings within specification limits.
(For non-normal distributions, see Percentile Method. Let us now review some of the major indices that are commonly used to describe process capability.
Capability Analysis - Process Capability Indices
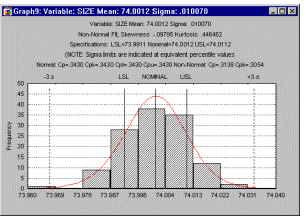
Process range. First, it is customary to establish the � 3 sigma limits around the nominal specifications. Actually, the sigma limits should be the same as the ones used to bring the process under control using Shewhart control charts (see Quality Control). These limits denote the range of the process (i.e., process range). If we use the � 3 sigma limits then, based on the normal distribution, we can estimate that approximately 99% of all piston rings fall within these limits.
Specification limits LSL, USL. Usually, engineering requirements dictate a range of acceptable values. In our example, it may have been determined that acceptable values for the piston ring diameters would be 74.0 � .02 millimeters. Thus, the lower specification limit (LSL) for our process is 74.0 - 0.02 = 73.98; the upper specification limit (USL) is 74.0 + 0.02 = 74.02. The difference between USL and LSL is called the specification range.
Potential capability (Cp). This is the simplest and most straightforward indicator of process capability. It is defined as the ratio of the specification range to the process range; using � 3 sigma limits we can express this index as:
Cp = (USL-LSL)/(6*Sigma)
Put into words, this ratio expresses the proportion of the range of the normal curve that falls within the engineering specification limits (provided that the mean is on target, that is, that the process is centered, see below).
Bhote (1988) reports that prior to the widespread use of statistical quality control techniques (prior to 1980), the normal quality of US manufacturing processes was approximately Cp = .67. This means that the two 33/2 percent tail areas of the normal curve fall outside specification limits. As of 1988, only about 30% of US processes are at or below this level of quality (see Bhote, 1988, p. 51). Ideally, of course, we would like this index to be greater than 1, that is, we would like to achieve a process capability so that no (or almost no) items fall outside specification limits. Interestingly, in the early 1980's the Japanese manufacturing industry adopted as their standard Cp = 1.33! The process capability required to manufacture high-tech products is usually even higher than this; Minolta has established a Cp index of 2.0 as their minimum standard (Bhote, 1988, p. 53), and as the standard for its suppliers. Note that high process capability usually implies lower, not higher costs, taking into account the costs due to poor quality. We will return to this point shortly.
Capability ratio (Cr). This index is equivalent to Cp; specifically, it is computed as 1/Cp (the inverse of Cp).
Lower/upper potential capability: Cpl, Cpu. A major shortcoming of the Cp (and Cr) index is that it may yield erroneous information if the process is not on target, that is, if it is not centered. We can express non-centering via the following quantities. First, upper and lower potential capability indices can be computed to reflect the deviation of the observed process mean from the LSL and USL.. Assuming � 3 sigma limits as the process range, we compute:
Cpl = (Mean - LSL)/3*Sigma
and
Cpu = (USL - Mean)/3*Sigma
Obviously, if these values are not identical to each other, then the process is not centered.
Non-centering correction (K). We can correct Cp for the effects of non-centering. Specifically, we can compute:
K=abs(D - Mean)/(1/2*(USL - LSL))
where
D = (USL+LSL)/2.
This correction factor expresses the non-centering (target specification minus mean) relative to the specification range.
Demonstrated excellence (Cpk). Finally, we can adjust Cp for the effect of non-centering by computing:
Cpk = (1-k)*Cp
If the process is perfectly centered, then k is equal to zero, and Cpk is equal to Cp. However, as the process drifts from the target specification, k increases and Cpk becomes smaller than Cp.
Potential Capability II: Cpm. A recent modification (Chan, Cheng, & Spiring, 1988) to Cp is directed at adjusting the estimate of sigma for the effect of (random) non-centering. Specifically, we may compute the alternative sigma (Sigma2) as:
Sigma2 = { (xi - TS)2/(n-1)}½
where:
Sigma2 is the alternative estimate of sigma
xi is the value of the i'th observation in the sample
TS is the target or nominal specification
n is the number of observations in the sample
We may then use this alternative estimate of sigma to compute Cp as before; however, we will refer to the resultant index as Cpm.
Process Performance vs. Process Capability
When monitoring a process via a quality control chart (e.g., the X-bar and R-chart; Quality Control) it is often useful to compute the capability indices for the process. Specifically, when the data set consists of multiple samples, such as data collected for the quality control chart, then one can compute two different indices of variability in the data. One is the regular standard deviation for all observations, ignoring the fact that the data consist of multiple samples; the other is to estimate the process's inherent variation from the within-sample variability. For example, when plotting X-bar and R-charts one may use the common estimator R-bar/d2 for the process sigma (e.g., see Duncan, 1974; Montgomery, 1985, 1991). Note however, that this estimator is only valid if the process is statistically stable. For a detailed discussion of the difference between the total process variation and the inherent variation refer to ASQC/AIAG reference manual (ASQC/AIAG, 1991, page 80).
When the total process variability is used in the standard capability computations, the resulting indices are usually referred to as process performance indices (as they describe the actual performance of the process), while indices computed from the inherent variation (within- sample sigma) are referred to as capability indices (since they describe the inherent capability of the process).
Using Experiments to Improve Process Capability
As mentioned before, the higher the Cp index, the better the process -- and there is virtually no upper limit to this relationship. The issue of quality costs, that is, the losses due to poor quality, is discussed in detail in the context of Taguchi robust design methods (see Experimental Design). In general, higher quality usually results in lower costs overall; even though the costs of production may increase, the losses due to poor quality, for example, due to customer complaints, loss of market share, etc. are usually much greater. In practice, two or three well-designed experiments carried out over a few weeks can often achieve a Cp of 5 or higher. If you are not familiar with the use of designed experiments, but are concerned with the quality of a process, we strongly recommend that you review the methods detailed in Experimental Design.
Testing the Normality Assumption
The indices we have just reviewed are only meaningful if, in fact, the quality characteristic that is being measured is normally distributed. A specific test of the normality assumption (Kolmogorov-Smirnov and Chi-square test of goodness-of-fit) is available; these tests are described in most statistics textbooks, and they are also discussed in greater detail in Nonparametrics and Distribution Fitting.
A visual check for normality is to examine the probability-probability and quantile- quantile plots for the normal distribution. For more information, see Process Analysis and Non-Normal Distributions.
Tolerance Limits
Before the introduction of process capability indices in the early 1980's, the common method for estimating the characteristics of a production process was to estimate and examine the tolerance limits of the process (see, for example, Hald, 1952). The logic of this procedure is as follows. Let us assume that the respective quality characteristic is normally distributed in the population of items produced; we can then estimate the lower and upper interval limits that will ensure with a certain level of confidence (probability) that a certain percent of the population is included in those limits. Put another way, given:
See also, Non-Normal Distributions.
| To index |
Introductory Overview
Gage repeatability and reproducibility analysis addresses the issue of precision of measurement. The purpose of repeatability and reproducibility experiments is to determine the proportion of measurement variability that is due to (1) the items or parts being measured (part-to-part variation), (2) the operator or appraiser of the gages (reproducibility), and (3) errors (unreliabilities) in the measurements over several trials by the same operators of the same parts (repeatability). In the ideal case, all variability in measurements will be due to the part-to- part variation, and only a negligible proportion of the variability will be due to operator reproducibility and trial-to-trial repeatability.
To return to the piston ring example , if we require detection of deviations from target specifications of the magnitude of .01 millimeters, then we obviously need to use gages of sufficient precision. The procedures described here allow the engineer to evaluate the precision of gages and different operators (users) of those gages, relative to the variability of the items in the population.
You can compute the standard indices of repeatability, reproducibility, and part-to-part variation, based either on ranges (as is still common in these types of experiments) or from the analysis of variance (ANOVA) table (as, for example, recommended in ASQC/AIAG, 1990, page 65). The ANOVA table will also contain an F test (statistical significance test) for the operator-by-part interaction, and report the estimated variances, standard deviations, and confidence intervals for the components of the ANOVA model.
Finally, you can compute the respective percentages of total variation, and report so-called percent-of-tolerance statistics. These measures are briefly discussed in the following sections of this introduction. Additional information can be found in Duncan (1974), Montgomery (1991), or the DataMyte Handbook (1992); step-by-step instructions and examples are also presented in the ASQC/AIAG Measurement systems analysis reference manual (1990) and the ASQC/AIAG Fundamental statistical process control reference manual (1991).
Note that there are several other statistical procedures which may be used to analyze these types of designs; see the section on Methods for Analysis of Variance for details. In particular the methods discussed in the Variance Components and Mixed Model ANOVA/ANCOVA chapter are very efficient for analyzing very large nested designs (e.g., with more than 200 levels overall), or hierarchically nested designs (with or without random factors).
Computational Approach
One may think of each measurement as consisting of the following components:
We can design an experiment to estimate the magnitudes of each component, that is, the repeatability, reproducibility, and the variability between parts, and thus assess the precision of the measurement system. In essence, this procedure amounts to an analysis of variance (ANOVA) on an experimental design which includes as factors different parts, operators, and repeated measurements (trials). We can then estimate the corresponding variance components (the term was first used by Daniels, 1939) to assess the repeatability (variance due to differences across trials), reproducibility (variance due to differences across operators), and variability between parts (variance due to differences across parts). If you are not familiar with the general idea of ANOVA, you may want to refer to ANOVA/MANOVA. In fact, the extensive features provided there can also be used to analyze repeatability and reproducibility studies.
Plots of Repeatability and Reproducibility
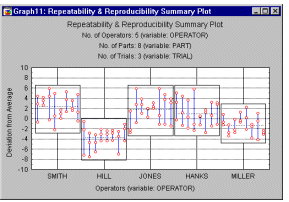
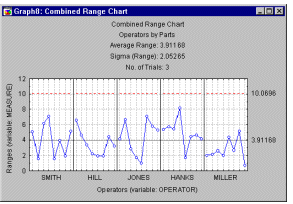
There are several ways to summarize via graphs the findings from a repeatability and reproducibility experiment. For example, suppose we are manufacturing small kilns that are used for drying materials for other industrial production processes. The kilns should operate at a target temperature of around 100 degrees Celsius. In this study, 5 different engineers (operators) measured the same sample of 8 kilns (parts), three times each (three trials). We can plot the mean ratings of the 8 parts by operator. If the measurement system is reproducible, then the pattern of means across parts should be quite consistent across the 5 engineers who participated in the study.
R and S charts. Quality Control discusses in detail the idea of R (range) and S (sigma) plots for controlling process variability. We can apply those ideas here and produce a plot of ranges (or sigmas) by operators or by parts; these plots will allow us to identify outliers among operators or parts. If one operator produced particularly wide ranges of measurements, we may want to find out why that particular person had problems producing reliable measurements (e.g., perhaps he or she failed to understand the instructions for using the measurement gage).
Analogously, producing an R chart by parts may allow us to identify parts that are particularly difficult to measure reliably; again, inspecting that particular part may give us some insights into the weaknesses in our measurement system.
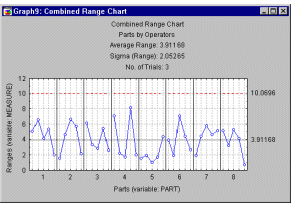
Repeatability and reproducibility summary plot. The summary plot shows the individual measurements by each operator; specifically, the measurements are shown in terms of deviations from the respective average rating for the respective part. Each trial is represented by a point, and the different measurement trials for each operator for each part are connected by a vertical line. Boxes drawn around the measurements give us a general idea of a particular operator's bias (see graph below).
Components of Variance (see also the Variance Components chapter)
Percent of Process Variation and Tolerance. The Percent Tolerance allows you to evaluate the performance of the measurement system with regard to the overall process variation, and the respective tolerance range. You can specify the tolerance range (Total tolerance for parts) and the Number of sigma intervals. The latter value is used in the computations to define the range (spread) of the respective (repeatability, reproducibility, part-to- part, etc.) variability. Specifically, the default value (5.15) defines 5.15 times the respective sigma estimate as the respective range of values; if the data are normally distributed, then this range defines 99% of the space under the normal curve, that is, the range that will include 99% of all values (or reproducibility/repeatability errors) due to the respective source of variation.
Percent of process variation. This value reports the variability due to different sources relative to the total variability (range) in the measurements.
Analysis of Variance. Rather than computing variance components estimates based on ranges, an accurate method for computing these estimates is based on the ANOVA mean squares (see Duncan, 1974, ASQC/AIAG, 1990 ).
One may treat the three factors in the R & R experiment (Operator, Parts, Trials) as random factors in a three-way ANOVA model (see also General ANOVA/MANOVA). For details concerning the different models that are typically considered, refer to ASQC/AIAG (1990, pages 92-95), or to Duncan (1974, pages 716-734). Customarily, it is assumed that all interaction effects by the trial factor are non-significant. This assumption seems reasonable, since, for example, it is difficult to imagine how the measurement of some parts will be systematically different in successive trials, in particular when parts and trials are randomized.
However, the Operator by Parts interaction may be important. For example, it is conceivable that certain less experienced operators will be more prone to particular biases, and hence will arrive at systematically different measurements for particular parts. If so, then one would expect a significant two-way interaction (again, refer to General ANOVA/MANOVA if you are not familiar with ANOVA terminology).
In the case when the two-way interaction is statistically significant, then one can separately estimate the variance components due to operator variability, and due to the operator by parts variability
In the case of significant interactions, the combined repeatability and reproducibility variability is defined as the sum of three components: repeatability (gage error), operator variability, and the operator-by-part variability.
If the Operator by Part interaction is not statistically significant a simpler additive model can be used without interactions.
Summary
To summarize, the purpose of the repeatability and reproducibility procedures is to allow the quality control engineer to assess the precision of the measurement system (gages) used in the quality control process. Obviously, if the measurement system is not repeatable (large variability across trials) or reproducible (large variability across operators) relative to the variability between parts, then the measurement system is not sufficiently precise to be used in the quality control efforts. For example, it should not be used in charts produced via Quality Control, or product capability analyses and acceptance sampling procedures via Process Analysis.
| To index |
Introductory Overview
General Purpose. The concept of process capability is described in detail in the Process Capabillity Overview. To reiterate, when judging the quality of a (e.g., production) process it is useful to estimate the proportion of items produced that fall outside a predefined acceptable specification range. For example, the so-called Cp index is computed as:
Cp - (USL-LSL)/(6*sigma)
where sigma is the estimated process standard deviation, and USL and LSL are the upper and lower specification limits, respectively. If the distribution of the respective quality characteristic or variable (e.g., size of piston rings) is normal, and the process is perfectly centered (i.e., the mean is equal to the design center), then this index can be interpreted as the proportion of the range of the standard normal curve (the process width) that falls within the engineering specification limits. If the process is not centered, an adjusted index Cpk is used instead.
Non-Normal Distributions. You can fit non-normal distributions to the observed histogram, and compute capability indices based on the respective fitted non-normal distribution (via the percentile method). In addition, instead of computing capability indices by fitting specific distributions, you can compute capability indices based on two different general families of distributions -- the Johnson distributions (Johnson, 1965; see also Hahn and Shapiro, 1967) and Pearson distributions (Johnson, Nixon, Amos, and Pearson, 1963; Gruska, Mirkhani, and Lamberson, 1989; Pearson and Hartley, 1972) -- which allow the user to approximate a wide variety of continuous distributions. For all distributions, the user can also compute the table of expected frequencies, the expected number of observations beyond specifications, and quantile-quantile and probability-probability plots. The specific method for computing process capability indices from these distributions is described in Clements (1989).
Quantile-quantile plots and probability-probability plots. There are various methods for assessing the quality of respective fit to the observed data. In addition to the table of observed and expected frequencies for different intervals, and the Kolmogorov-Smirnov and Chi-square goodness-of-fit tests, you can compute quantile and probability plots for all distributions. These scatterplots are constructed so that if the observed values follow the respective distribution, then the points will form a straight line in the plot. These plots are described further below.
Fitting Distributions by Moments
In addition to the specific continuous distributions described above, you can fit general "families" of distributions -- the so-called Johnson and Pearson curves -- with the goal to match the first four moments of the observed distribution.
General approach. The shapes of most continuous distributions can be sufficiently summarized in the first four moments. Put another way, if one fits to a histogram of observed data a distribution that has the same mean (first moment), variance (second moment), skewness (third moment) and kurtosis (fourth moment) as the observed data, then one can usually approximate the overall shape of the distribution very well. Once a distribution has been fitted, one can then calculate the expected percentile values under the (standardized) fitted curve, and estimate the proportion of items produced by the process that fall within the specification limits.
Johnson curves. Johnson (1949) described a system of frequency curves that represents transformations of the standard normal curve (see Hahn and Shapiro, 1967, for details). By applying these transformations to a standard normal variable, a wide variety of non- normal distributions can be approximated, including distributions which are bounded on either one or both sides (e.g., U-shaped distributions). The advantage of this approach is that once a particular Johnson curve has been fit, the normal integral can be used to compute the expected percentage points under the respective curve. Methods for fitting Johnson curves, so as to approximate the first four moments of an empirical distribution, are described in detail in Hahn and Shapiro, 1967, pages 199-220; and Hill, Hill, and Holder, 1976.
Pearson curves. Another system of distributions was proposed by Karl Pearson (e.g., see Hahn and Shapiro, 1967, pages 220-224). The system consists of seven solutions (of 12 originally enumerated by Pearson) to a differential equation which also approximate a wide range of distributions of different shapes. Gruska, Mirkhani, and Lamberson (1989) describe in detail how the different Pearson curves can be fit to an empirical distribution. A method for computing specific Pearson percentiles is also described in Davis and Stephens (1983).
Assessing the Fit: Quantile and Probability Plots
For each distribution, you can compute the table of expected and observed frequencies and the respective Chi-square goodness-of-fit test, as well as the Kolmogorov-Smirnov d test. However, the best way to assess the quality of the fit of a theoretical distribution to an observed distribution is to review the plot of the observed distribution against the theoretical fitted distribution. There are two standard types of plots used for this purpose: Quantile- quantile plots and probability-probability plots.
Quantile-quantile plots. In quantile-quantile plots (or Q-Q plots for short), the observed values of a variable are plotted against the theoretical quantiles. To produce a Q-Q plot, you first sort the n observed data points into ascending order, so that:
x1  x2 ... xn
These observed values are plotted against one axis of the graph; on the other axis the plot will show:
F-1 ((i-radj)/(n+nadj))
where i is the rank of the respective observation, radj and nadj are adjustment factors ( 0.5) and F-1 denotes the inverse of the probability integral for the respective standardized distribution. The resulting plot (see example below) is a scatterplot of the observed values against the (standardized) expected values, given the respective distribution. Note that, in addition to the inverse probability integral value, you can also show the respective cumulative probability values on the opposite axis, that is, the plot will show not only the standardized values for the theoretical distribution, but also the respective p-values.
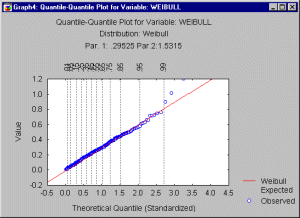
A good fit of the theoretical distribution to the observed values would be indicated by this plot if the plotted values fall onto a straight line. Note that the adjustment factors radj and nadj ensure that the p-value for the inverse probability integral will fall between 0 and 1, but not including 0 and 1 (see Chambers, Cleveland, Kleiner, and Tukey, 1983).
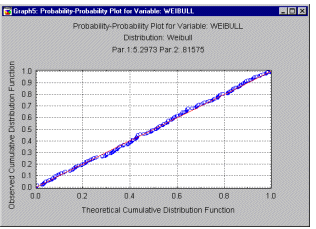
Probability-probability plots. In probability-probability plots (or P-P plots for short) the observed cumulative distribution function is plotted against the theoretical cumulative distribution function. As in the Q-Q plot, the values of the respective variable are first sorted into ascending order. The i'th observation is plotted against one axis as i/n (i.e., the observed cumulative distribution function), and against the other axis as F(x(i)), where F(x(i)) stands for the value of the theoretical cumulative distribution function for the respective observation x(i). If the theoretical cumulative distribution approximates the observed distribution well, then all points in this plot should fall onto the diagonal line (as in the graph below).
Non-Normal Process Capability Indices (Percentile Method)
As described earlier, process capability indices are generally computed to evaluate the quality of a process, that is, to estimate the relative range of the items manufactured by the process (process width) with regard to the engineering specifications. For the standard, normal- distribution-based, process capability indices, the process width is typically defined as 6 times sigma, that is, as plus/minus 3 times the estimated process standard deviation. For the standard normal curve, these limits (zl = -3 and zu = +3) translate into the 0.135 percentile and 99.865 percentile, respectively. In the non-normal case, the 3 times sigma limits as well as the mean (zM = 0.0) can be replaced by the corresponding standard values, given the same percentiles, under the non- normal curve. This procedure is described in detail by Clements (1989).
Process capability indices. Shown below are the formulas for the non-normal process capability indices:
Cp = (USL-LSL)/(Up-Lp)
CpL = (M-LSL)/(M-Lp)
CpU = (USL-M)/(Up-M)
Cpk = Min(CpU, CpL)
In these equations, M represents the 50'th percentile value for the respective fitted distribution, and Up and Lp are the 99.865 and .135 percentile values, respectively, if the computations are based on a process width of �3 times sigma. Note that the values for Up and Lp may be different, if the process width is defined by different sigma limits (e.g., �2 times sigma).
| To index |
The reliability of a product or component constitutes an important aspect of product quality. Of particular interest is the quantification of a product's reliability, so that one can derive estimates of the product's expected useful life. For example, suppose you are flying a small single engine aircraft. It would be very useful (in fact vital) information to know what the probability of engine failure is at different stages of the engine's "life" (e.g., after 500 hours of operation, 1000 hours of operation, etc.). Given a good estimate of the engine's reliability, and the confidence limits of this estimate, one can then make a rational decision about when to swap or overhaul the engine.
A useful general distribution for describing failure time data is the Weibull distribution (see also Weibull CDF, reliability, and hazard functions). The distribution is named after the Swedish professor Waloddi Weibull, who demonstrated the appropriateness of this distribution for modeling a wide variety of different data sets (see also Hahn and Shapiro, 1967; for example, the Weibull distribution has been used to model the life times of electronic components, relays, ball bearings, or even some businesses).
Hazard function and the bathtub curve. It is often meaningful to consider the function that describes the probability of failure during a very small time increment (assuming that no failures have occurred prior to that time). This function is called the hazard function (or, sometimes, also the conditional failure, intensity, or force of mortality function), and is generally defined as:
h(t) = f(t)/(1-F(t))
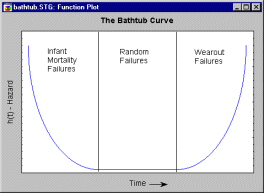
where h(t) stands for the hazard function (of time t), and f(t) and F(t) are the probability density and cumulative distribution functions, respectively. The hazard (conditional failure) function for most machines (components, devices) can best be described in terms of the "bathtub" curve: Very early during the life of a machine, the rate of failure is relatively high (so-called Infant Mortality Failures); after all components settle, and the electronic parts are burned in, the failure rate is relatively constant and low. Then, after some time of operation, the failure rate again begins to increase (so-called Wear-out Failures), until all components or devices will have failed.
For example, new automobiles often suffer several small failures right after they were purchased. Once these have been "ironed out," a (hopefully) long relatively trouble-free period of operation will follow. Then, as the car reaches a particular age, it becomes more prone to breakdowns, until finally, after 20 years and 250000 miles, practically all cars will have failed. A typical bathtub hazard function is shown below.
The Weibull distribution is flexible enough for modeling the key stages of this typical bathtub-shaped hazard function. Shown below are the hazard functions for shape parameters c=.5, c=1, c=2, and c=5.
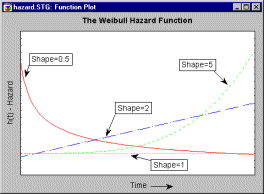
Clearly, the early ("infant mortality") "phase" of the bathtub can be approximated by a Weibull hazard function with shape parameter c<1; the constant hazard phase of the bathtub can be modeled with a shape parameter c=1, and the final ("wear-out") stage of the bathtub with c>1.
Cumulative distribution and reliability functions. Once a Weibull distribution (with a particular set of parameters) has been fit to the data, a number of additional important indices and measures can be estimated. For example, you can compute the cumulative distribution function (commonly denoted as F(t)) for the fitted distribution, along with the standard errors for this function. Thus, you can determine the percentiles of the cumulative survival (and failure) distribution, and, for example, predict the time at which a predetermined percentage of components can be expected to have failed.
The reliability function (commonly denoted as R(t)) is the complement to the cumulative distribution function (i.e., R(t)=1-F(t)); the reliability function is also sometimes referred to as the survivorship or survival function (since it describes the probability of not failing or of surviving until a certain time t; e.g., see Lee, 1992). Shown below is the reliability function for the Weibull distribution, for different shape parameters.
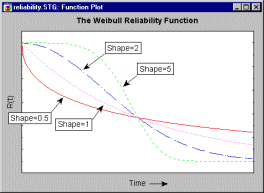
For shape parameters less than 1, the reliability decreases sharply very early in the respective product's life, and then slowly thereafter. For shape parameters greater than 1, the initial drop in reliability is small, and then the reliability drops relatively sharply at some point later in time. The point where all curves intersect is called the characteristic life: regardless of the shape parameter, 63.2 percent of the population will have failed at or before this point (i.e., R(t) = 1-0.632 = .368). This point in time is also equal to the respective scale parameter b of the two-parameter Weibull distribution (with  = 0; otherwise it is equal to b+).
The formulas for the Weibull cumulative distribution, reliability, and hazard functions are shown in the Weibull CDF, reliability, and hazard functions section.
In most studies of product reliability, not all items in the study will fail. In other words, by the end of the study the researcher only knows that a certain number of items have not failed for a particular amount of time, but has no knowledge of the exact failure times (i.e., "when the items would have failed"). Those types of data are called censored observations. The issue of censoring, and several methods for analyzing censored data sets, are also described in great detail in the context of Survival Analysis. Censoring can occur in many different ways.
Type I and II censoring. So-called Type I censoring describes the situation when a test is terminated at a particular point in time, so that the remaining items are only known not to have failed up to that time (e.g., we start with 100 light bulbs, and terminate the experiment after a certain amount of time). In this case, the censoring time is often fixed, and the number of items failing is a random variable. In Type II censoring the experiment would be continued until a fixed proportion of items have failed (e.g., we stop the experiment after exactly 50 light bulbs have failed). In this case, the number of items failing is fixed, and time is the random variable.
Left and right censoring. An additional distinction can be made to reflect the "side" of the time dimension at which censoring occurs. In the examples described above, the censoring always occurred on the right side (right censoring), because the researcher knows when exactly the experiment started, and the censoring always occurs on the right side of the time continuum. Alternatively, it is conceivable that the censoring occurs on the left side (left censoring). For example, in biomedical research one may know that a patient entered the hospital at a particular date, and that s/he survived for a certain amount of time thereafter; however, the researcher does not know when exactly the symptoms of the disease first occurred or were diagnosed.
Single and multiple censoring. Finally, there are situations in which censoring can occur at different times (multiple censoring), or only at a particular point in time (single censoring). To return to the light bulb example, if the experiment is terminated at a particular point in time, then a single point of censoring exists, and the data set is said to be single-censored. However, in biomedical research multiple censoring often exists, for example, when patients are discharged from a hospital after different amounts (times) of treatment, and the researcher knows that the patient survived up to those (differential) points of censoring.
The methods described in this section are applicable primarily to right censoring, and single- as well as multiple-censored data.
Two- and three-parameter Weibull distribution
The Weibull distribution is bounded on the left side. If you look at the probability density function, you can see that that the term x- must be greater than 0. In most cases, the location parameter (theta) is known (usually 0): it identifies the smallest possible failure time. However, sometimes the probability of failure of an item is 0 (zero) for some time after a study begins, and in that case it may be necessary to estimate a location parameter that is greater than 0. There are several methods for estimating the location parameter of the three-parameter Weibull distribution. To identify situations when the location parameter is greater than 0, Dodson (1994) recommends to look for downward of upward sloping tails on a probability plot (see below), as well as large (>6) values for the shape parameter after fitting the two-parameter Weibull distribution, which may indicate a non-zero location parameter.
Maximum likelihood estimation. Standard iterative function minimization methods can be used to compute maximum likelihood parameter estimates for the two- and three parameter Weibull distribution. The specific methods for estimating the parameters are described in Dodson (1994); a detailed description of a Newton-Raphson iterative method for estimating the maximum likelihood parameters for the two-parameter distribution is provided in Keats and Lawrence (1997).
The estimation of the location parameter for the three-parameter Weibull distribution poses a number of special problems, which are detailed in Lawless (1982). Specifically, when the shape parameter is less than 1, then a maximum likelihood solution does not exist for the parameters. In other instances, the likelihood function may contain more than one maximum (i.e., multiple local maxima). In the latter case, Lawless basically recommends using the smallest failure time (or a value that is a little bit less) as the estimate of the location parameter.
Nonparametric (rank-based) probability plots. One can derive a descriptive estimate of the cumulative distribution function (regardless of distribution) by first rank-ordering the observations, and then computing any of the following expressions:
Median rank:
F(t) = (j-0.3)/(n+0.4)
Mean rank:
F(t) = j/(n+1)
White's plotting position:
F(t) = (j-3/8)/(n+1/4)
where j denotes the failure order (rank; for multiple-censored data a weighted average ordered failure is computed; see Dodson, p. 21), and n is the total number of observations. One can then construct the following plot.
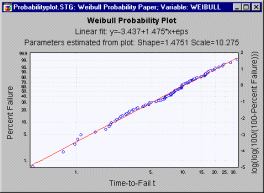
Note that the horizontal Time axis is scaled logarithmically; on the vertical axis the quantity log(log(100/(100-F(t))) is plotted (a probability scale is shown on the left-y axis). From this plot the parameters of the two-parameter Weibull distribution can be estimated; specifically, the shape parameter is equal to the slope of the linear fit-line, and the scale parameter can be estimated as exp(-intercept/slope).
Estimating the location parameter from probability plots. It is apparent in the plot shown above that the regression line provides a good fit to the data. When the location parameter is misspecified (e.g., not equal to zero), then the linear fit is worse as compared to the case when it is appropriately specified. Therefore, one can compute the probability plot for several values of the location parameter, and observe the quality of the fit. These computations are summarized in the following plot.
Here the common R-square measure (correlation squared) is used to express the quality of the linear fit in the probability plot, for different values of the location parameter shown on the horizontal x axis (this plot is based on the example data set in Dodson, 1994, Table 2.9). This plot is often very useful when the maximum likelihood estimation procedure for the three-parameter Weibull distribution fails, because it shows whether or not a unique (single) optimum value for the location parameter exists (as in the plot shown above).
Hazard plotting. Another method for estimating the parameters for the two-parameter Weibull distribution is via hazard plotting (as discussed earlier, the hazard function describes the probability of failure during a very small time increment, assuming that no failures have occurred prior to that time). This method is very similar to the probability plotting method. First plot the cumulative hazard function against the logarithm of the survival times; then fit a linear regression line and compute the slope and intercept of that line. As in probability plotting, the shape parameter can then be estimated as the slope of the regression line, and the scale parameter as exp(-intercept/slope). See Dodson (1994) for additional details; see also Weibull CDF, reliability, and hazard functions.
Method of moments. This method -- to approximate the moments of the observed distribution by choosing the appropriate parameters for the Weibull distribution -- is also widely described in the literature. In fact, this general method is used for fitting the Johnson curves general non-normal distribution to the data, to compute non-normal process capability indices (see Fitting Distributions by Moments). However, the method is not suited for censored data sets, and is therefore not very useful for the analysis of failure time data.
Comparing the estimation methods. Dodson (1994) reports the result of a Monte Carlo simulation study, comparing the different methods of estimation. In general, the maximum likelihood estimates proved to be best for large sample sizes (e.g., n>15), while probability plotting and hazard plotting appeared to produce better (more accurate) estimates for smaller samples.
A note of caution regarding maximum likelihood based confidence limits. Many software programs will compute confidence intervals for maximum likelihood estimates, and for the reliability function based on the standard errors of the maximum likelihood estimates. Dodson (1994) cautions against the interpretation of confidence limits computed from maximum likelihood estimates, or more precisely, estimates that involve the information matrix for the estimated parameters. When the shape parameter is less than 2, the variance estimates computed for maximum likelihood estimates lack accuracy, and it is advisable to compute the various results graphs based on nonparametric confidence limits as well.
A number of different tests have been proposed for evaluating the quality of the fit of the Weibull distribution to the observed data. These tests are discussed and compared in detail in Lawless (1982).
Hollander-Proschan. This test compares the theoretical reliability function to the Kaplan-Meier estimate. The actual computations for this test are somewhat complex, and you may refer to Dodson (1994, Chapter 4) for a detailed description of the computational formulas. The Hollander-Proschan test is applicable to complete, single-censored, and multiple-censored data sets; however, Dodson (1994) cautions that the test may sometimes indicate a poor fit when the data are heavily single-censored. The Hollander-Proschan C statistic can be tested against the normal distribution (z).
Mann-Scheuer-Fertig. This test, proposed by Mann, Scheuer, and Fertig (1973), is described in detail in, for example, Dodson (1994) or Lawless (1982). The null hypothesis for this test is that the population follows the Weibull distribution with the estimated parameters. Nelson (1982) reports this test to have reasonably good power, and this test can be applied to Type II censored data. For computational details refer to Dodson (1994) or Lawless (1982); the critical values for the test statistic have been computed based on Monte Carlo studies, and have been tabulated for n (sample sizes) between 3 and 25.
Anderson-Darling. The Anderson-Darling procedure is a general test to compare the fit of an observed cumulative distribution function to an expected cumulative distribution function. However, this test is only applicable to complete data sets (without censored observations). The critical values for the Anderson-Darling statistic have been tabulated (see, for example, Dodson, 1994, Table 4.4) for sample sizes between 10 and 40; this test is not computed for n less than 10 and greater than 40.
Once a satisfactory fit of the Weibull distribution to the observed failure time data has been obtained, there are a number of different plots and tables that are of interest to understand the reliability of the item under investigation. If a good fit for the Weibull cannot be established, distribution-free reliability estimates (and graphs) should be reviewed to determine the shape of the reliability function.
Reliability plots. This plot will show the estimated reliability function along with the confidence limits.
Note that nonparametric (distribution-free) estimates and their standard errors can also be computed and plotted.
Hazard plots. As mentioned earlier, the hazard function describes the probability of failure during a very small time increment (assuming that no failures have occurred prior to that time). The plot of hazard as a function of time gives valuable information about the conditional failure probability.
Percentiles of the reliability function. Based on the fitted Weibull distribution, one can compute the percentiles of the reliability (survival) function, along with the confidence limits for these estimates (for maximum likelihood parameter estimates). These estimates are particularly valuable for determining the percentages of items that can be expected to have failed at particular points in time.
In some cases, failure time data are presented in grouped form. Specifically, instead of having available the precise failure time for each observation, only aggregate information is available about the number of items that failed or were censored in a particular time interval. Such life-table data input is also described in the context of the Survival Analysis chapter. There are two general approaches for fitting the Weibull distribution to grouped data.
First, one can treat the tabulated data as if they were continuous. In other words, one can "expand" the tabulated values into continuous data by assuming (1) that each observation in a given time interval failed exactly at the interval mid-point (interpolating out "half a step" for the last interval), and (2) that censoring occurred after the failures in each interval (in other words, censored observations are sorted after the observed failures). Lawless (1982) advises that this method is usually satisfactory if the class intervals are relatively narrow.
Alternatively, you may treat the data explicitly as a tabulated life table, and use a weighted least squares methods algorithm (based on Gehan and Siddiqui, 1973; see also Lee, 1992) to fit the Weibull distribution (Lawless, 1982, also describes methods for computing maximum likelihood parameter estimates from grouped data).
Modified Failure Order for Multiple-Censored Data
For multiple-censored data a weighted average ordered failure is calculated for each failure after the first censored data point. These failure orders are then used to compute the median rank, to estimate the cumulative distribution function.
The modified failure order j is computed as (see Dodson 1994):
Ij = ((n+1)-Op)/(1+c)
where:
Ij is the increment for the j'th failure
n is the total number of data points
Op is the failure order of the previous observation (and Oj = Op + Ij)
c is the number of data points remaining in the data set, including the current data point
The median rank is then computed as:
F(t) = (Ij -0.3)/(n+0.4)
where Ij denotes the modified failure order, and n is the total number of observations.
Weibull CDF, Reliability, and Hazard
Density function. The Weibull distribution (Weibull, 1939, 1951; see also Lieblein, 1955) has density function (for positive parameters b, c, and ):
f(x) = c/b*[(x- )/b]c-1 * e^{-[(x-)/b]c}
< x, b > 0, c > 0
where
b is the scale parameter of the distribution
c is the shape parameter of the distribution
is the location parameter of the distribution
e is the
base of the natural logarithm, sometimes called Euler's e (2.71...)
Cumulative distribution function (CDF). The Weibull distribution has the cumulative distribution function (for positive parameters b, c, and ):
F(x) = 1 - exp{-[(x-)/b]c}
using the same notation and symbols as described above for the density function.
Reliability function. The Weibull reliability function is the complement of the cumulative distribution function:
R(x) = 1 - F(x)
Hazard function. The hazard function describes the probability of failure during a very small time increment, assuming that no failures have occurred prior to that time. The Weibull distribution has the hazard function (for positive parameters b, c, and ):
h(t) = f(t)/R(t) = [c*(x-)(c-1)] / bc
using the same notation and symbols as described above for the density and reliability functions.
Cumulative hazard function. The Weibull distribution has the cumulative hazard function (for positive parameters b, c, and ):
H(t) = (x-) / bc
using the same notation and symbols as described above for the density and reliability functions.
| To index |