Estimating the Variance |
Simulation of the mean estimation experiment
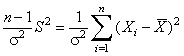
We will now consider the problem of constructing confidence bounds for the variance of a normal distribution. It is natural to start with a special multiple of the sample variance
because we have shown that this statistic has the chi-square distribution with n - 1 degrees of freedom.
If p is a number in (0, 1), we will denote the p'th quantile of the chi-squared distribution with n degrees of freedom by
For selected values of n and p, these quantiles are given in the table of the chi-squared distribution.
![]() 1. Show that
1. Show that
![]() 2. Show that the expression in
Exercise 1 can be equivalently written as
2. Show that the expression in
Exercise 1 can be equivalently written as
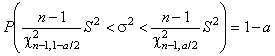
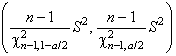
It follows from Exercise 2 that
is a 1 - a confidence interval for the distribution variance. Note that, in general, this confidence interval is not symmetric about the sample variance. This contrasts with confidence intervals for the distribution mean, which are always symmetric about the sample mean.
![]() 3. Show that a 1 - a
confidence interval for the distribution standard deviation can
be obtained by taking square roots of the confidence bounds
above.
3. Show that a 1 - a
confidence interval for the distribution standard deviation can
be obtained by taking square roots of the confidence bounds
above.
![]() 4. Use a derivation similar to
Exercises 1 and 2 to show that a 1 - a confidence lower
bound for the distribution variance is
4. Use a derivation similar to
Exercises 1 and 2 to show that a 1 - a confidence lower
bound for the distribution variance is
![]() 5. Show that a 1 - a
confidence lower bound for the distributin standard deviation can
be obtained by taking the square root of the confidence bound in
Exercise 4.
5. Show that a 1 - a
confidence lower bound for the distributin standard deviation can
be obtained by taking the square root of the confidence bound in
Exercise 4.
![]() 6. Use a derivation similar to
Exercises 1 and 2 to show that a 1 - a confidence upper
bound for the distribution variance is
6. Use a derivation similar to
Exercises 1 and 2 to show that a 1 - a confidence upper
bound for the distribution variance is
![]() 7. Show that a 1 - a
confidence upper bound for the distribution standard deviation
can be obtained by taking the square root of the confidence bound
in Exercise 6.
7. Show that a 1 - a
confidence upper bound for the distribution standard deviation
can be obtained by taking the square root of the confidence bound
in Exercise 6.
![]() 8. In the interval estimate experiment, select
the normal distribution with mean 0 and standard deviation 5. Run
the experiment 100 times, updating after every run. For each run,
compute the 0.95 confidence interval for the variance. Over the
100 runs, compute the relative frequency of successes and compare
with the confidence level.
8. In the interval estimate experiment, select
the normal distribution with mean 0 and standard deviation 5. Run
the experiment 100 times, updating after every run. For each run,
compute the 0.95 confidence interval for the variance. Over the
100 runs, compute the relative frequency of successes and compare
with the confidence level.
Even when the underlying distribution is not normal, the procedure of this section is still used to obtain approximate confidence bounds for the variance. If the distribution is not too far from normal, the procedure is sufficiently robust and usually works well.
![]() 9. In the interval estimate experiment, select
the Gamma distribution
with shape parameter 1 and scale parameter 1. Run the experiment
100 times, updating after every run. For each run, compute the
0.95 confidence interval for the variance. Over the 100 runs,
compute the relative frequency of successes and compare with the
confidence level.
9. In the interval estimate experiment, select
the Gamma distribution
with shape parameter 1 and scale parameter 1. Run the experiment
100 times, updating after every run. For each run, compute the
0.95 confidence interval for the variance. Over the 100 runs,
compute the relative frequency of successes and compare with the
confidence level.
![]() 10. In the interval estimate experiment, select
the Gamma distribution with shape parameter 5 and scale parameter
1. Run the experiment 100 times, updating after every run. For
each run, compute the 0.90 confidence interval for the variance.
Over the 100 runs, compute the relative frequency of successes
and compare with the confidence level.
10. In the interval estimate experiment, select
the Gamma distribution with shape parameter 5 and scale parameter
1. Run the experiment 100 times, updating after every run. For
each run, compute the 0.90 confidence interval for the variance.
Over the 100 runs, compute the relative frequency of successes
and compare with the confidence level.
![]() 11. In the interval estimate experiment, select
the Poisson distribution with mean 1. Run the experiment 100
times, updating after every run. For each run, compute the 0.90
confidence interval for the variance. Over the 100 runs, compute
the relative frequency of successes and compare with the
confidence level.
11. In the interval estimate experiment, select
the Poisson distribution with mean 1. Run the experiment 100
times, updating after every run. For each run, compute the 0.90
confidence interval for the variance. Over the 100 runs, compute
the relative frequency of successes and compare with the
confidence level.
Interval Estimation |