Joint Distributions |
Simulation of the bivariate uniform experiment
Suppose that X and Y are random vectors for the same experiment. Suppose also that X takes values in a subset S of Rn and Y takes values in a subset T of Rm. Let Z = (X, Y). We can think of Z as a random vector taking values in the subset S × T of Rn + m.
The purpose of this section is to study how the distribution of Z is related to the distributions of X and Y.
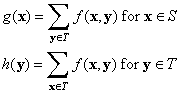
![]() 1. Suppose that Z
is discrete with density function f. Show that X
and Y are discrete and have density functions g
and h, respectively, given by
1. Suppose that Z
is discrete with density function f. Show that X
and Y are discrete and have density functions g
and h, respectively, given by
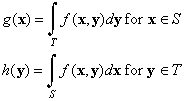
![]() 2. Suppose that Z
is continuous with density function f. Show that X
and Y are continuous and have density functions g
and h, respectively, given by
2. Suppose that Z
is continuous with density function f. Show that X
and Y are continuous and have density functions g
and h, respectively, given by
In the context of Exercises 1 and 2, f is called the joint density function of Z = (X, Y), while g and h are called the marginal density functions of X and of Y, respectively. The main idea to notice is that the joint distribution of (X, Y) determines the marginal distributions of X and of Y. However, the converse is not true; the joint distribution contains much more information, in general, than the marginal distributions. Only when the random variables are independent do the marginal distributions give the joint distribution.
![]() 3. Suppose that X
and Y are independent and either both discrete
or both continuous, with density functions g and h
respectively. Let f(x, y)
= g(x)h(y)
for x in S and y in T.
Show that Z = (X, Y)
has density function f .
3. Suppose that X
and Y are independent and either both discrete
or both continuous, with density functions g and h
respectively. Let f(x, y)
= g(x)h(y)
for x in S and y in T.
Show that Z = (X, Y)
has density function f .
The following exercise gives a converse to Exercise 3. If the joint density factors into a function of x only and a function of y only, then X and Y are independent.
![]() 4. Suppose that Z
= (X, Y) is either discrete or
continuous with density function f. Suppose that
4. Suppose that Z
= (X, Y) is either discrete or
continuous with density function f. Suppose that
f(x, y) = u(x)v(y) for x in S, y in T
where u is a function on S and v is a function on T. Show that X and Y are independent and that there exists a nonzero constant c such that the functions g and h given below are densities for X and Y respectively.
g(x) = cu(x) for x in S; h(y) = v(y) / c for y in T
Bivariate uniform distributions provide nice examples of the ideas in the last section. First, suppose that R is a subset of R2 with finite, positive area a. Recall that (X, Y) is uniformly distributed on R if the joint density is
f(x, y) = 1 / a for (x, y) in R
![]() 5. Show that X
takes values in the set S = {x: (x, y)
in R for some y} that the density function g
of X is proportional to the vertical cross-sectional
length function:
5. Show that X
takes values in the set S = {x: (x, y)
in R for some y} that the density function g
of X is proportional to the vertical cross-sectional
length function:
g(x) = length{y: (x, y) in R}/ a for x in S
![]() 6. Show that Y
takes values in the set T = {y: (x, y)
in R for some x} that the density function h
of Y is proportional to the horizontal cross-sectional
length function:
6. Show that Y
takes values in the set T = {y: (x, y)
in R for some x} that the density function h
of Y is proportional to the horizontal cross-sectional
length function:
h(y) = length{x: (x, y) in R}/ a for y in S
In particular, note from Exercises 5 and 6 that X and Y are in general not uniformly distributed.
![]() 7. Suppose that R
is a product set, R = S × T. Show
that
7. Suppose that R
is a product set, R = S × T. Show
that
In the bivariate uniform simulation, the random vector (X, Y) is uniformly distributed on one of three regions that can be selected from the list box:
When you run the simulation, the values of (X, Y) are ploted in the scatterplot on the left. The other two graphs show the marginal densities of X and Y in blue and the corresponding empirical densities in red. The table on the left gives the values of X and Y. The middle tables give the mean, standard deviation, sample mean and sample standard deviation of X and of Y. The table on the right gives the correlation and sample correlation between X and Y.
![]() 8. Suppose that (X,
Y) is uniformly distributed on the square (1). Find the
joint density function of (X, Y) and the
marginal densities of X and of Y.
8. Suppose that (X,
Y) is uniformly distributed on the square (1). Find the
joint density function of (X, Y) and the
marginal densities of X and of Y.
![]() 9. In the bivariate uniform simulation, select square
in the list box. Run the simulation 5000 times, updating every 10
runs. Watch the points in the scatter plot and the graphs of the
marginal distributions. Interpret what you see in the context of
Exercises 5-7 and 8.
9. In the bivariate uniform simulation, select square
in the list box. Run the simulation 5000 times, updating every 10
runs. Watch the points in the scatter plot and the graphs of the
marginal distributions. Interpret what you see in the context of
Exercises 5-7 and 8.
![]() 10. Suppose that (X,
Y) is uniformly distributed on the triangle (2). Find
the joint density function of (X, Y) and the
marginal densities of X and of Y.
10. Suppose that (X,
Y) is uniformly distributed on the triangle (2). Find
the joint density function of (X, Y) and the
marginal densities of X and of Y.
![]() 11. In the bivariate uniform simulation, select square
in the list box. Run the simulation 5000 times, updating every 10
runs. Watch the points in the scatter plot and the graphs of the
marginal distributions. Interpret what you see in the context of
Exercises 5, 6, and 10.
11. In the bivariate uniform simulation, select square
in the list box. Run the simulation 5000 times, updating every 10
runs. Watch the points in the scatter plot and the graphs of the
marginal distributions. Interpret what you see in the context of
Exercises 5, 6, and 10.
![]() 12. Suppose that (X,
Y) is uniformly distributed on the circle (1). Find the
joint density function of (X, Y) and the
marginal densities of X and of Y.
12. Suppose that (X,
Y) is uniformly distributed on the circle (1). Find the
joint density function of (X, Y) and the
marginal densities of X and of Y.
![]() 13. In the bivariate uniform simulation, select circle
in the list box. Run the simulation 5000 times, updating every 10
runs. Watch the points in the scatter plot and the graphs of the
marginal distributions. Interpret what you see in the context of
Exercises 5, 6, and 12.
13. In the bivariate uniform simulation, select circle
in the list box. Run the simulation 5000 times, updating every 10
runs. Watch the points in the scatter plot and the graphs of the
marginal distributions. Interpret what you see in the context of
Exercises 5, 6, and 12.
![]() 14. Suppose that (X,
Y) has probability density function f given by
14. Suppose that (X,
Y) has probability density function f given by
f(x, y) = (x + y) / 4 for 0 < x < y < 2
Find the probability density functions of X and of Y and then determine if X and Y are independent.
![]() 15. Suppose that (X,
Y) has probability density function f given by
15. Suppose that (X,
Y) has probability density function f given by
f(x, y) = (x + y) / 3 for 0 < x < 1, 0 < y < 2
Find the probability density functions of X and of Y and then determine if X and Y are independent.
![]() 16. Suppose that (X,
Y) has probability density function f given by
16. Suppose that (X,
Y) has probability density function f given by
f(x, y) = (15 / 32) x2y for 0 < x < y < 2.
Find the probability density functions of X and of Y and then determine if X and Y are independent.
![]() 17. Suppose that (X,
Y) has probability density function f given by
17. Suppose that (X,
Y) has probability density function f given by
f(x, y) = (3 / 2) x2y for 0 < x < 1, 0 < y < 2
Find the probability density functions of X and of Y and then determine if X and Y are independent.
Distributions |